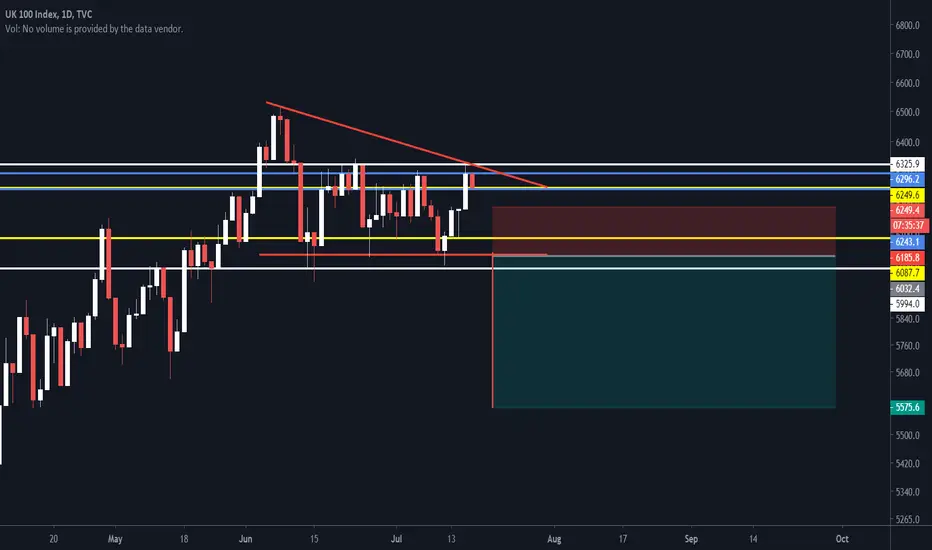
key:
dark blue lines are day
yellow lines are yellow
white lines are month
red lines are patterns (descending triangle)
what we have here on the daily time frame is a descending triangle winch means the price will probably brake to the down side
Also u can see that yesterday we had a candle up to the months high at 6,325 and got pushed back down to blue line at 6,296.
as u can see with to days open we had a rejection off the previous days high and have support on today's low
how i would trade this is wait till the brake out happens to know direction
Disclaimer
The information and publications are not meant to be, and do not constitute, financial, investment, trading, or other types of advice or recommendations supplied or endorsed by TradingView. Read more in the Terms of Use.
Disclaimer
The information and publications are not meant to be, and do not constitute, financial, investment, trading, or other types of advice or recommendations supplied or endorsed by TradingView. Read more in the Terms of Use.