#UMA/USDT
 UMA is above long term ascending support and weekly candlestick pattern is bullish.
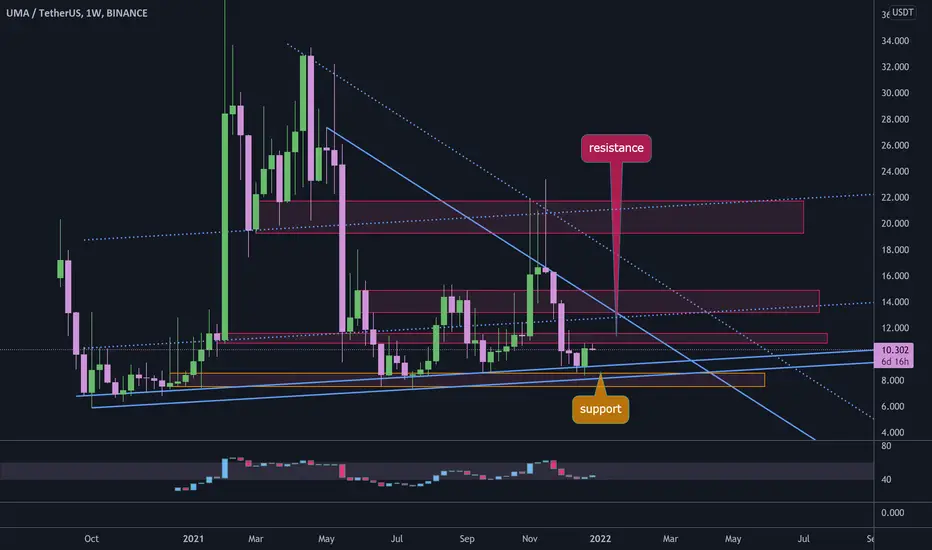
so price can head up from here toward descending resistance line where a resistance zone and parallel trend line meet. breaking out from this zone will increase price to next resistance zone around $20.
so price can head up from here toward descending resistance line where a resistance zone and parallel trend line meet. breaking out from this zone will increase price to next resistance zone around $20.
Disclaimer
The information and publications are not meant to be, and do not constitute, financial, investment, trading, or other types of advice or recommendations supplied or endorsed by TradingView. Read more in the Terms of Use.
Disclaimer
The information and publications are not meant to be, and do not constitute, financial, investment, trading, or other types of advice or recommendations supplied or endorsed by TradingView. Read more in the Terms of Use.