Last night BTC dumped dragging the market with it, UMA included. This changed the chart pattern into a big bull flag. Yesterday I had checked UMABTC pattern which is less important than the stable coin pair and it was already in a bull flag, so now they both pairs have the same pattern.
Now there are 2 possiible ways out:
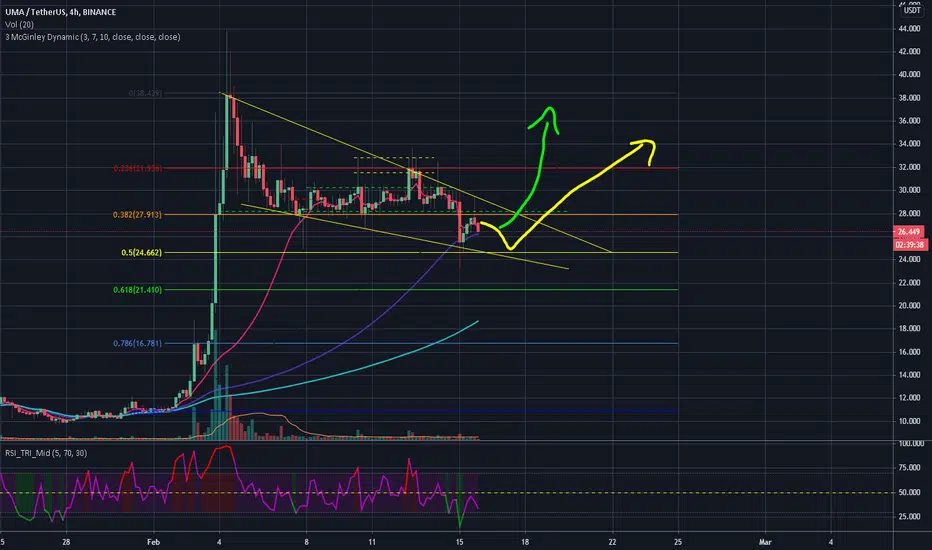
1) volume spikes bringing new liquidity and the price will do something similar to the green pattern I've drawn;
2) price will keep retracing but, according with TA rules, usually bull flags end retracement around 0.5 Fib level which shoul be the area of the bounce back attracting new liquidity because of the proximity to the break of the pattern (yellow line),
By default I'm never optimistic, I try to be realistic with a tendency to pessimism, so I'm expecting option 2 with a bounce which can be around 0.5 Fib, not necessarily exactly on the line.
A thing is certain though, I expect a break out within 3-4 days. If, like me, you're in from more than a week keep up and don't sell before this thing touches AT LEAST 45, but keep in mind that it has the potential to go much more. Let's squeeze the maximum profit out of this fucker, it's the least it can do after so much patience!
P.S.
green dashed line within the flag is a resistance I had identified days ago and, currently, coincide with 50 EMA line at this timeframe and 200 EMA at 1h timeframe
Now there are 2 possiible ways out:
1) volume spikes bringing new liquidity and the price will do something similar to the green pattern I've drawn;
2) price will keep retracing but, according with TA rules, usually bull flags end retracement around 0.5 Fib level which shoul be the area of the bounce back attracting new liquidity because of the proximity to the break of the pattern (yellow line),
By default I'm never optimistic, I try to be realistic with a tendency to pessimism, so I'm expecting option 2 with a bounce which can be around 0.5 Fib, not necessarily exactly on the line.
A thing is certain though, I expect a break out within 3-4 days. If, like me, you're in from more than a week keep up and don't sell before this thing touches AT LEAST 45, but keep in mind that it has the potential to go much more. Let's squeeze the maximum profit out of this fucker, it's the least it can do after so much patience!
P.S.
green dashed line within the flag is a resistance I had identified days ago and, currently, coincide with 50 EMA line at this timeframe and 200 EMA at 1h timeframe
Note
So, it chose yellow path (told you being pessimistic is better lol). Price is following very carefully the path I've drawn... don't know if I'm good or lucky! :DAnyway to follow this path it must bounce over 24.18$ otherwise it'll keep going down another leg.
Note
it's following the bounce back on yello path and now is consolidating within the wedge. BTC permitting it'll keep going up and eventually break outNote
there's a big green candle on 1h chart, volume is spiking and the price has broke out the wedge. It's very likely that price will retest the wedge. We have a lot of way to do to reach 45$ first and 60$ afterI do TA because I like and it seems at least 70% of my calls usually turn out to be true. If you wanna support me please donate some tradingview coin or check "about me"
Disclaimer
The information and publications are not meant to be, and do not constitute, financial, investment, trading, or other types of advice or recommendations supplied or endorsed by TradingView. Read more in the Terms of Use.
I do TA because I like and it seems at least 70% of my calls usually turn out to be true. If you wanna support me please donate some tradingview coin or check "about me"
Disclaimer
The information and publications are not meant to be, and do not constitute, financial, investment, trading, or other types of advice or recommendations supplied or endorsed by TradingView. Read more in the Terms of Use.