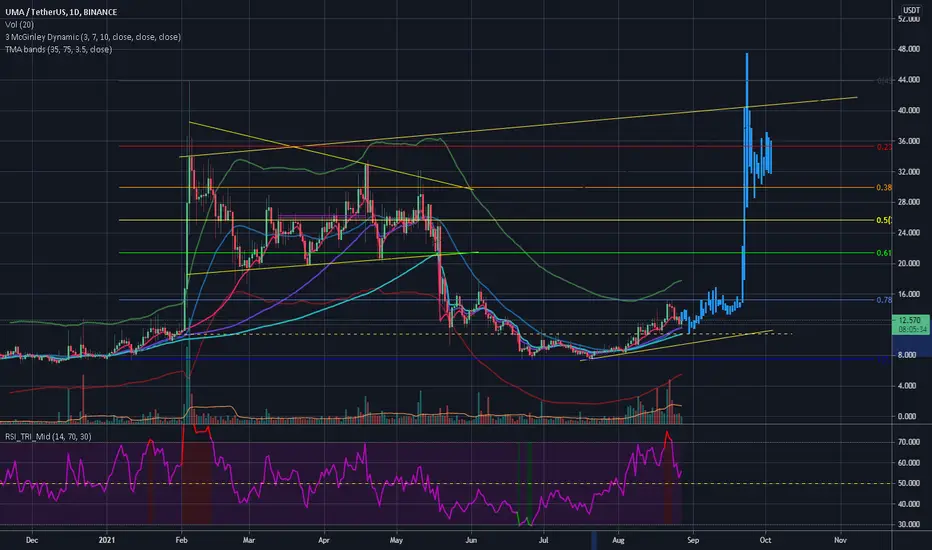
UMA was disappointing during the past bear wave as it retraced more than it should have, especially if you compare it with other projects, indeed as you can see, it touched the 1 Fib line. However the dump is over and as the rest of the market it's starting to slowly rise up.
Since the chart is pretty "young" my TA it's kinda a speculation. Supposing it'll repeat what it did in the past the half circle at the bottom is almost over. I've used the bars pattern to show how it could go but offo course this is not very accurate, however if you check how price was in the TMA before the last super pump and it is currently it seems we're on track for another pump.
What's accurate instead is that UMA's price bottomed on the 1 Fib level meaning from there we can only go up, especially until the end of this cycle (Q4 2021 I suppose). Check the yellow trend line though, if price touches that one it's still acceptable.
I hope my TA plays out, I'll try to keep you more posted about it but please, be aware I'm still working a lot.
I do TA because I like and it seems at least 70% of my calls usually turn out to be true. If you wanna support me please donate some tradingview coin or check "about me"
Disclaimer
The information and publications are not meant to be, and do not constitute, financial, investment, trading, or other types of advice or recommendations supplied or endorsed by TradingView. Read more in the Terms of Use.