UUMA/USDT Based on Weekly Chart
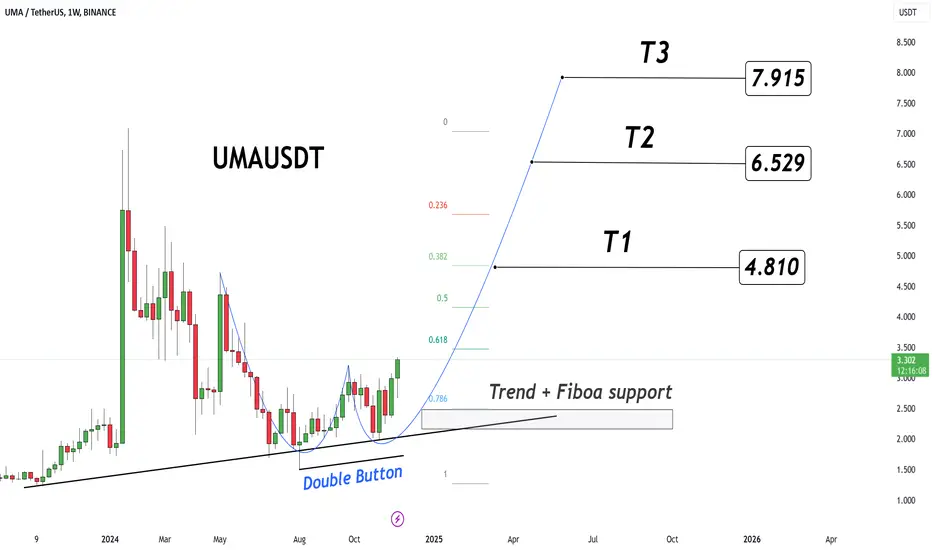
 UMA The chart showcases a Double Bottom formation near the Fibonacci support levels, which is a strong reversal signal.
The trendline support combined with Fibonacci retracement at the 0.618 level indicates solid buying interest and a potential bullish continuation.
The critical support lies at $2.50 - $3.00, which aligns with the trendline and Fibonacci 0.618 retracement level.
Resistance Levels (Targets):
T1: $4.810
T2: $6.529
T3: $7.915
Subscribe to my Telegram Channel 👉 :
t.me/addlist/y5mi70s3c0Y3MDQ0
Subscribe to my X 👉 : x.com/VIPROSETR
t.me/addlist/y5mi70s3c0Y3MDQ0
Subscribe to my X 👉 : x.com/VIPROSETR
Disclaimer
The information and publications are not meant to be, and do not constitute, financial, investment, trading, or other types of advice or recommendations supplied or endorsed by TradingView. Read more in the Terms of Use.