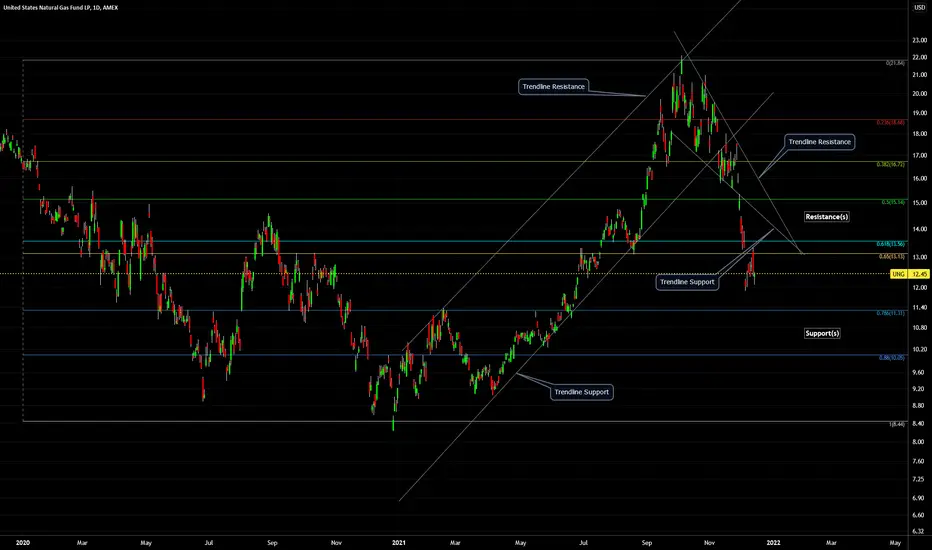
UNG (United States Natural Gas Fund) - 2021 - Support, Resistance, Trendlines:
-Resistance Price Levels (colored horizontal lines above current price)
-Support Price Levels (colored horizontal lines below current price)
-Trendline Resistances (diagonal grey lines above current price)
-Trendline Supports (diagonal grey lines below current price)
note: chart is on log scale.
-Resistance Price Levels (colored horizontal lines above current price)
-Support Price Levels (colored horizontal lines below current price)
-Trendline Resistances (diagonal grey lines above current price)
-Trendline Supports (diagonal grey lines below current price)
note: chart is on log scale.
Follow Me on TradingView, Youtube, X, Instagram.
Social Media links are in my profile.
Boost, comment, share to support.
All posts are not financial advice.
Social Media links are in my profile.
Boost, comment, share to support.
All posts are not financial advice.
Disclaimer
The information and publications are not meant to be, and do not constitute, financial, investment, trading, or other types of advice or recommendations supplied or endorsed by TradingView. Read more in the Terms of Use.