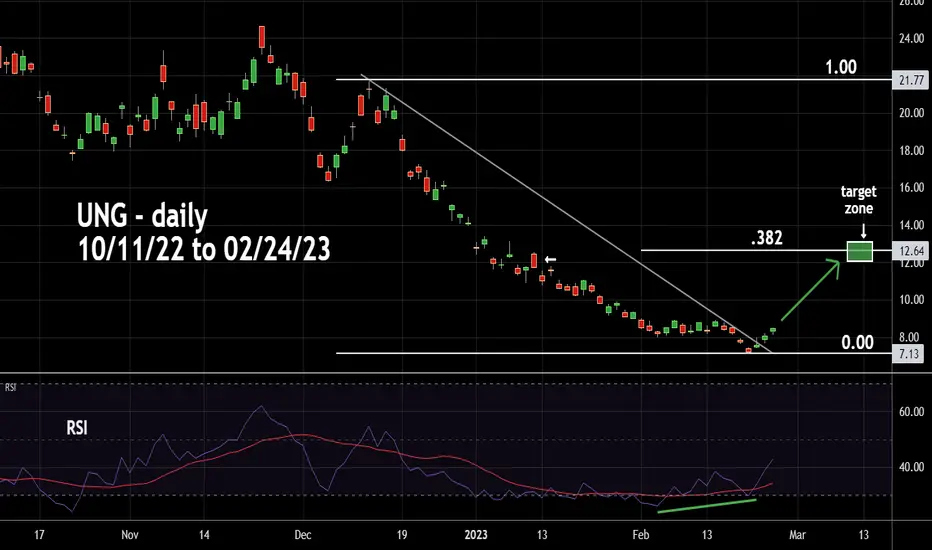
The Natural Gas ETF (UNG) has broken above the daily declining trendline.
The bottom this week had a significant RSI bullish divergence
Seasonal patterns for Natural Gas are bullish from mid - February to June.
UNG ended the 02/24/23 session near 8.50.
In the next few weeks it could reach 12.00 near Fibonacci and chart resistance.
Mark
The bottom this week had a significant RSI bullish divergence
Seasonal patterns for Natural Gas are bullish from mid - February to June.
UNG ended the 02/24/23 session near 8.50.
In the next few weeks it could reach 12.00 near Fibonacci and chart resistance.
Mark
Disclaimer
The information and publications are not meant to be, and do not constitute, financial, investment, trading, or other types of advice or recommendations supplied or endorsed by TradingView. Read more in the Terms of Use.
Disclaimer
The information and publications are not meant to be, and do not constitute, financial, investment, trading, or other types of advice or recommendations supplied or endorsed by TradingView. Read more in the Terms of Use.