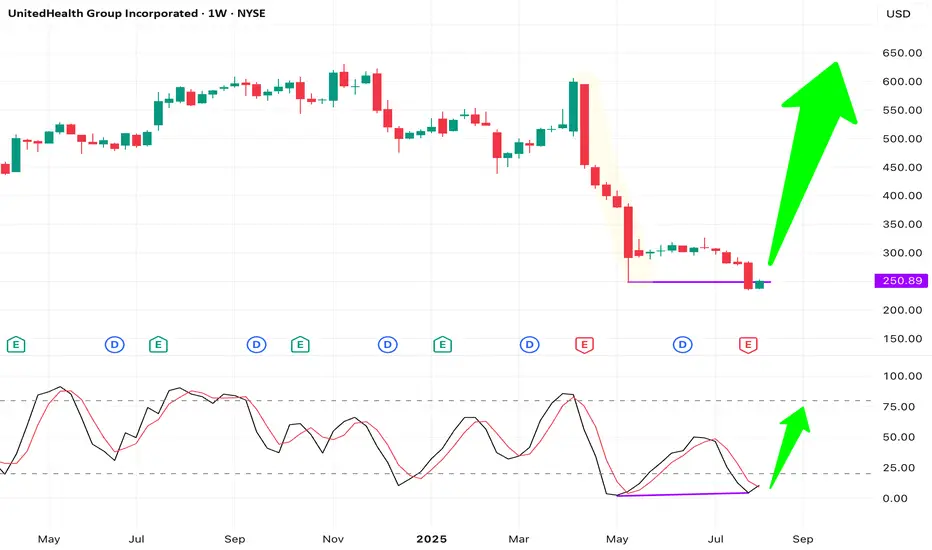
(Weekly Chart) NYSE: UNH remains a fundamentally strong company, even though healthcare is not currently the market’s leading sector. On the weekly chart, price action shows a force bottom (double bottom with take-out stops pattern), flushing stop-losses below the previous low at $248.88.
Last week, price closed back above the $250 support with a bullish candle. Price action and stochastic show a bullish divergence, with stochastic oversold and starting a golden cross. Risk-reward looks very favorable from this level.
Last week, price closed back above the $250 support with a bullish candle. Price action and stochastic show a bullish divergence, with stochastic oversold and starting a golden cross. Risk-reward looks very favorable from this level.
I follow price, not predictions.
Trends speak louder than opinions.
Follow me to stay updated with my latest trade setups.
Trends speak louder than opinions.
Follow me to stay updated with my latest trade setups.
Disclaimer
The information and publications are not meant to be, and do not constitute, financial, investment, trading, or other types of advice or recommendations supplied or endorsed by TradingView. Read more in the Terms of Use.