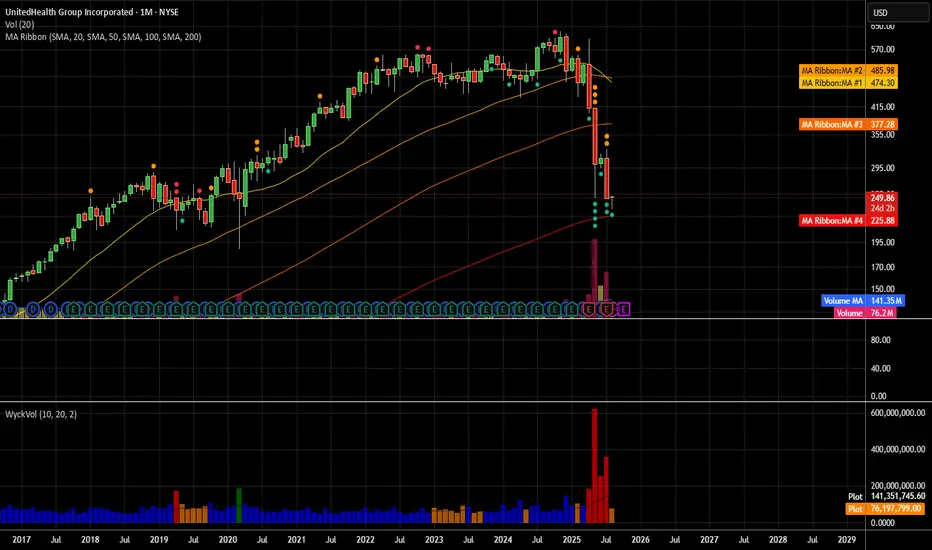
The price is currently around $250.51, rebounding after a steep drop.
There’s strong volume spike on the recent candles, suggesting capitulation selling and potential reversal.
The price is sitting near the SMA 200 on the monthly chart which historically acts as major long-term support.
Overhead resistance MAs: SMA/EMA 20/50 around $267–$280.
📈 Bullish Target Zones
First target (T1): $267 – near the 20/50 EMA/SMA cluster, where initial resistance is likely.
Second target (T2): $280–$285 – prior consolidation zone before breakdown.
Stretch target (T3): $300 – 310 retest of breakdown highs.
Disclaimer
The information and publications are not meant to be, and do not constitute, financial, investment, trading, or other types of advice or recommendations supplied or endorsed by TradingView. Read more in the Terms of Use.
Disclaimer
The information and publications are not meant to be, and do not constitute, financial, investment, trading, or other types of advice or recommendations supplied or endorsed by TradingView. Read more in the Terms of Use.