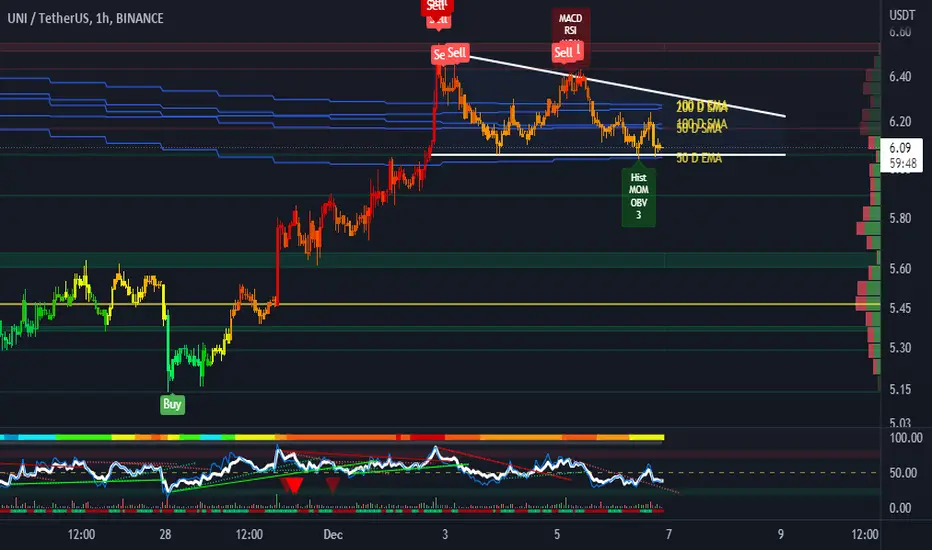
Idea: The price is forming a descending triangle. The daily 50 EMA is a key support level. The price may bounce to the upper border of the pattern. Breakout of the lower border of the triangle will be a strong reversal signal
Disclaimer
The information and publications are not meant to be, and do not constitute, financial, investment, trading, or other types of advice or recommendations supplied or endorsed by TradingView. Read more in the Terms of Use.
Disclaimer
The information and publications are not meant to be, and do not constitute, financial, investment, trading, or other types of advice or recommendations supplied or endorsed by TradingView. Read more in the Terms of Use.