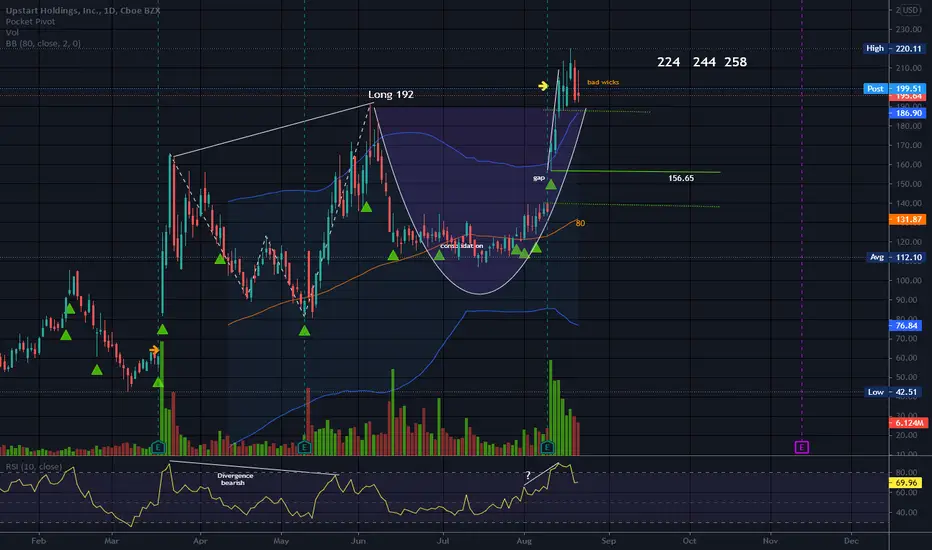
UPST is sending out a few warning signs that price may pull back. Price is over the band set on an 80 SMA. Price eventually returns to the bands.
GET a Good Long Entry Level if interested (o:
Bearish divergence on RSI a while back which has most likely corrected. Possible divergence on the steep climb after earnings as the price incline is much steeper than RSI.
Lots are bullish on this but long entry level can be crucial to your psyche. There is no true handle which would require a period of consolidation> Consolidation forms a source of support and I feel a bit better when I see it somewhere under price that is close by or at least in the ball park. I placed green lines where I see support. You may see it elsewhere.
I do not see any bearish rising wedges and that could even be a flag forming up there but too soon to know. In either case a pull back may be on the horizon.
Gap under price. Earnings are an event pattern and price will usually chill out within a week or two.
A crooked W took price to the prior high on the last notable leg up before this one. I did not Fib the W out to figure out which pattern it is as it no longer matters. Most likely a bearish harmonic pattern that hit the target before coming down. But folks can trade a bearish harmonic pattern if they recognize it on every leg with a mixture of going short and going long. After all, patterns like this are not so bearish if you got in at the bottom of the last leg up of that crooked W. But they are still referred to as bearish and bullish harmonic patterns. You can get stuck in a bearish leg of a bullish harmonic pattern as well, which usually appears as a crooked M. Just need to be sure to get out in time when a bearish harmonic pattern hits the end of the final leg up (because it is coming down) or in a bullish harmonic pattern, go long when it hits the landing pad (because it is usually going up.) (o: Current high is 220.11.
No recommendation.
Note
Candles with a long upper wick and little or no bottom shadow, especially a shooting star which has a very small body and very little or no bottom shadow but a tall upper wick, can point to pull backs if found at the top. At the bottom, this candle can be an inverted hammer, and is considered bullish, but not at the top. A shooting star reminds me of an upside down capitol T, but with a small candle body as the norm. If it has no body but a just a line, it is a gravestone doji which is also bearish at the top. This candle is more powerful on longer time frames like weekly or monthly. A long upper wick can also signal resistance.Disclaimer
The information and publications are not meant to be, and do not constitute, financial, investment, trading, or other types of advice or recommendations supplied or endorsed by TradingView. Read more in the Terms of Use.
Disclaimer
The information and publications are not meant to be, and do not constitute, financial, investment, trading, or other types of advice or recommendations supplied or endorsed by TradingView. Read more in the Terms of Use.