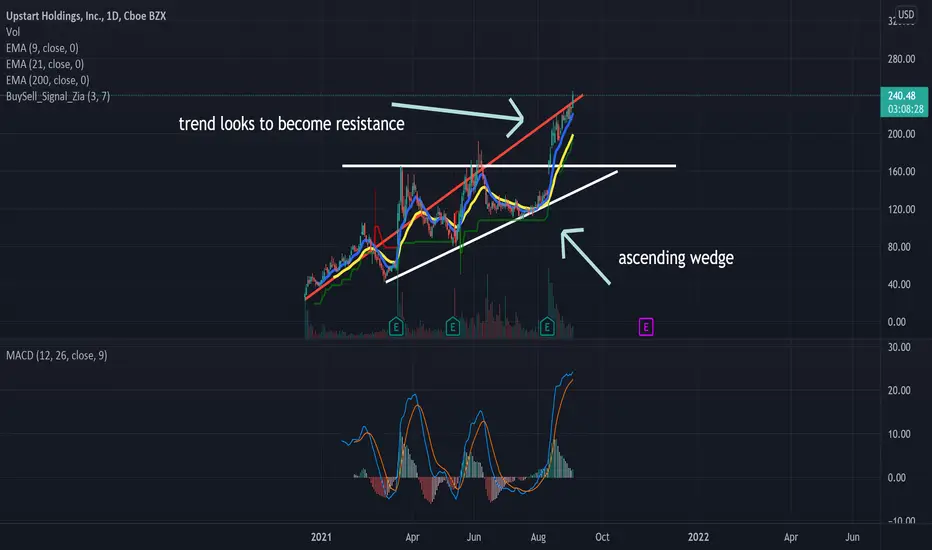
Okay so basically everything on this chart tells me to sell this bad boy short down about 20$ per share at the moment
the 4 hr time frame looks like hidden bullish divergence
but the daily looks like shes about to turn over
there is a divergence with volume and the higher highs
RSI on the daily looks like in can climb more
we just have to see where this takes us been watching for about a month
use stop losses I am currently in an airplane and dont want to pull my day trading app out live up here.....
Disclaimer
The information and publications are not meant to be, and do not constitute, financial, investment, trading, or other types of advice or recommendations supplied or endorsed by TradingView. Read more in the Terms of Use.
Disclaimer
The information and publications are not meant to be, and do not constitute, financial, investment, trading, or other types of advice or recommendations supplied or endorsed by TradingView. Read more in the Terms of Use.