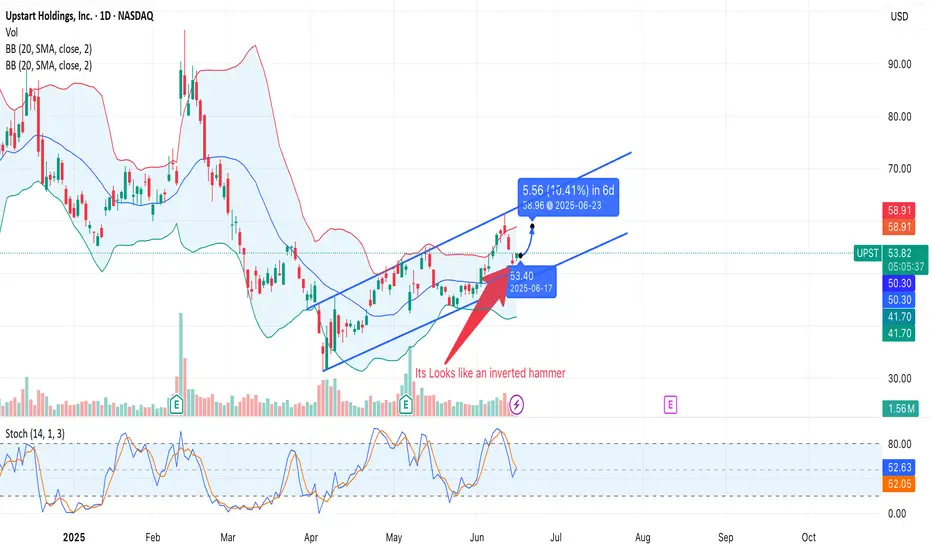
🔹 Candlestick Pattern: A candle resembling an inverted hammer has formed — this may signal potential weakness from buyers or a possible reversal after an upward move.
🔹 Technical Channel: The price is moving within an ascending channel. Target level is marked around $59.96 (+10.41% in 6 days).
🔹 Indicators:
• Bollinger Bands show price nearing the upper band, which can indicate overbought conditions.
• Stochastic RSI is approaching overbought territory (>50), suggesting a potential pullback.
🔹 Volume: Volume remains moderate with no significant spikes.
Conclusion:
UPST is showing a short-term bullish trend, but the appearance of an inverted hammer suggests caution. A pullback to the midline of the channel ($50–51) is possible before a potential continuation higher.
Disclaimer
The information and publications are not meant to be, and do not constitute, financial, investment, trading, or other types of advice or recommendations supplied or endorsed by TradingView. Read more in the Terms of Use.
Disclaimer
The information and publications are not meant to be, and do not constitute, financial, investment, trading, or other types of advice or recommendations supplied or endorsed by TradingView. Read more in the Terms of Use.