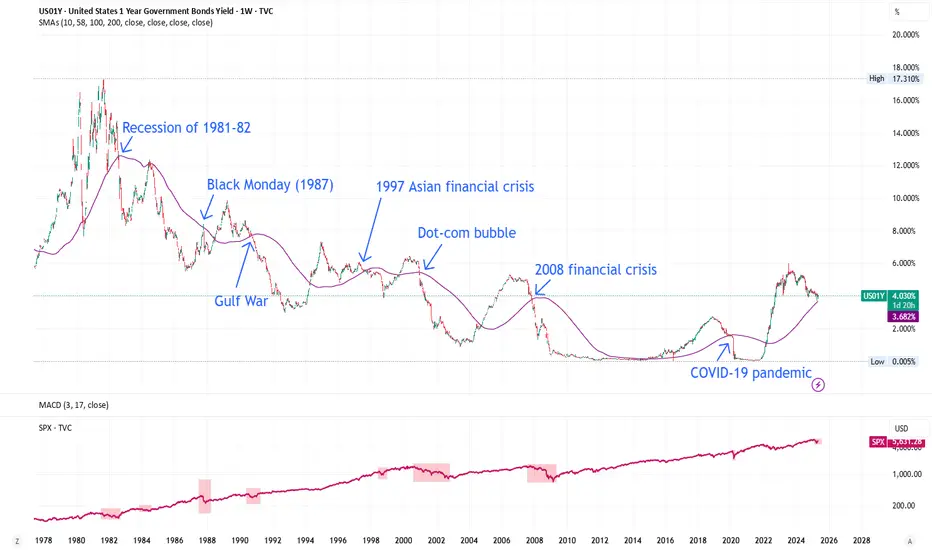
Using the 200 Week Moving Average,
we spot that stock crashes often relate with drop in short term bond yields.
Prior to 2008, yield rates usually drop by a few percents by hardly below 0.5%.
However since QE in 2008, bond yield decrease to a nearly 0% level.
These features allow us to spot these financial crisis on the graph easily.
However, whether if this indicator is leading indicator or lagging indicator requires future research.
Disclaimer
The information and publications are not meant to be, and do not constitute, financial, investment, trading, or other types of advice or recommendations supplied or endorsed by TradingView. Read more in the Terms of Use.
Disclaimer
The information and publications are not meant to be, and do not constitute, financial, investment, trading, or other types of advice or recommendations supplied or endorsed by TradingView. Read more in the Terms of Use.