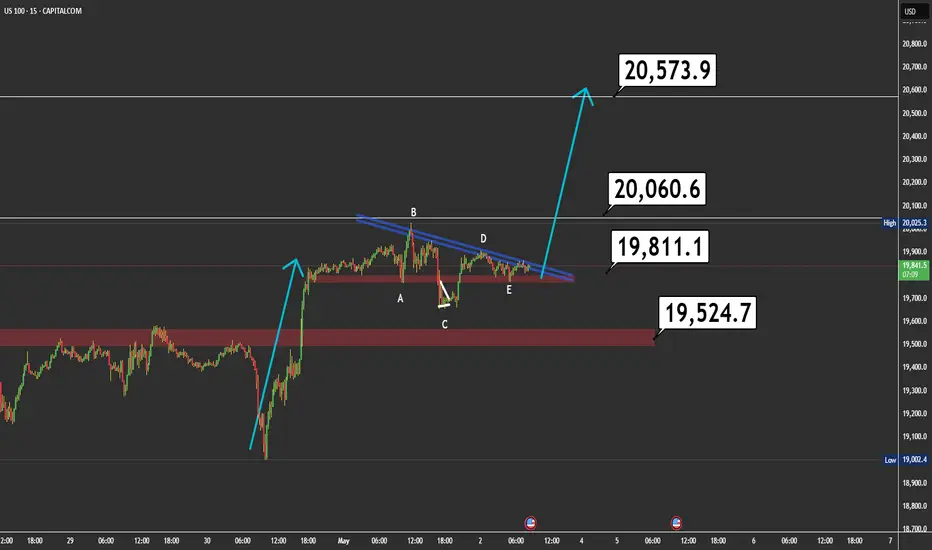
The NASDAQ (US100) is currently forming a descending triangle pattern with a clear A-B-C-D-E wave structure, signaling price compression and consolidation.
🔍 Key Insights:
The previous move was strongly bullish, increasing the probability of a continuation after consolidation.
A potential breakout above the descending trendline (blue resistance) could trigger a sharp upward move.
Target zones:
✅ First target: 20,060.6
✅ Second target: 20,573.9
Key support zone: 19,524.7 – this area acted as a launchpad for the previous bullish impulse and confirms the base of the triangle.
🧠 Suggested Strategy:
Wait for a confirmed breakout with volume. Look for entries on a pullback toward the 19,811.1 zone – ideally with a bullish continuation candle.
📊 Additional Context:
These types of consolidation patterns often lead to explosive moves. Patience and risk management will be crucial here.
Note
Disclaimer
The information and publications are not meant to be, and do not constitute, financial, investment, trading, or other types of advice or recommendations supplied or endorsed by TradingView. Read more in the Terms of Use.
Disclaimer
The information and publications are not meant to be, and do not constitute, financial, investment, trading, or other types of advice or recommendations supplied or endorsed by TradingView. Read more in the Terms of Use.