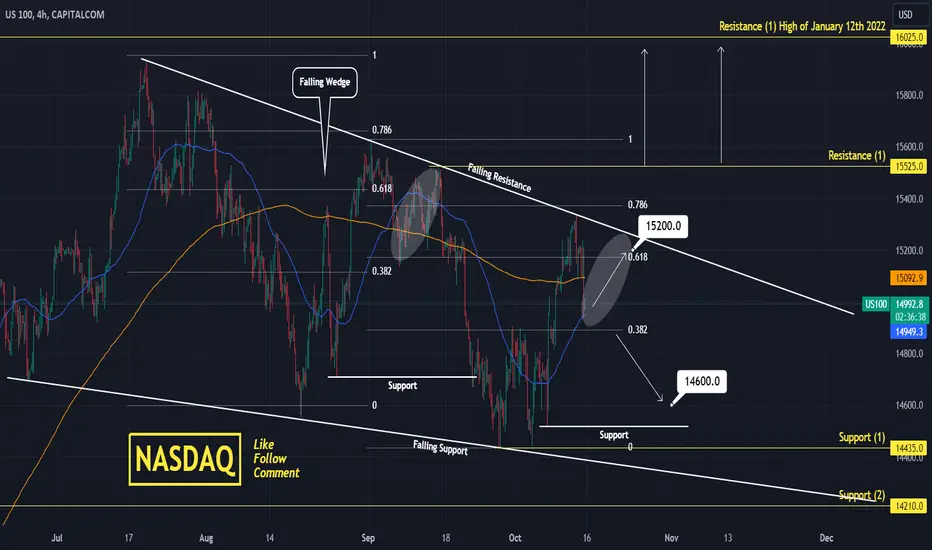
Nasdaq is on a correction leg after being rejected on the Falling Resistance of the Falling Wedge pattern, a little under the 0.786 Fibonacci level as the September 1st Lower High did.
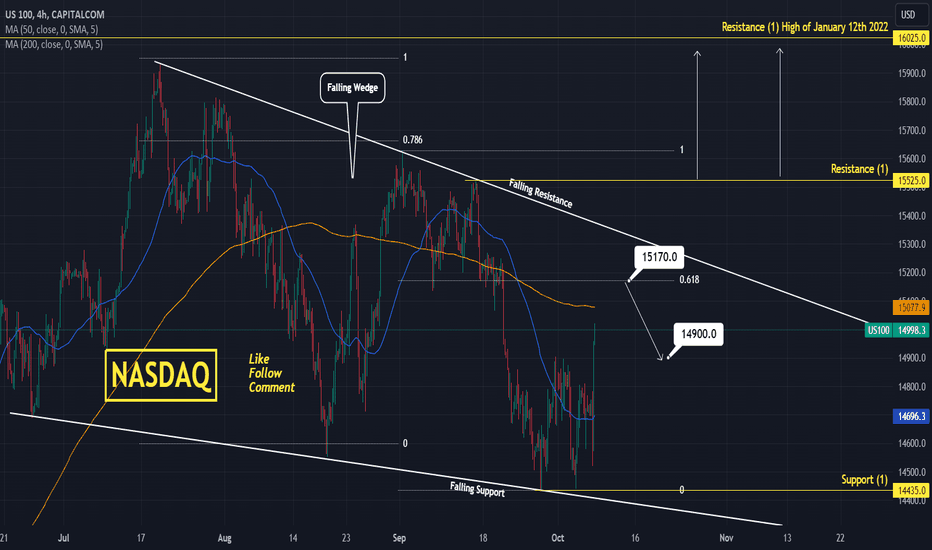
It hit today the MA50 (4h) and that can generate a short term rebound.
Below that, the correction of the Wedge will be extended lower.
Trading Plan:
1. Buy on the current market price.
2. Sell if the price closes a (1d) candle under the 0.382 Fibonacci level (as September 19th).
Targets:
1. 15200 (little over Fibonacci 0.618).
2. 14600 (over Support).
Tips:
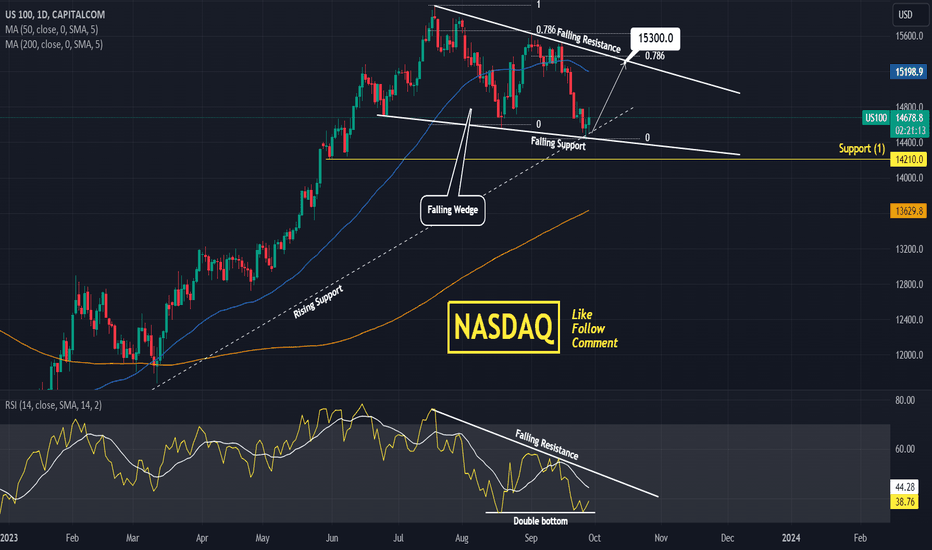
1. The Falling Wedge keeps the medium term bearish. We need a crossing over Resistance (1) to restore the long term bullish trend of 2023.
Please like, follow and comment!!
Notes:
Past trading plan:
It hit today the MA50 (4h) and that can generate a short term rebound.
Below that, the correction of the Wedge will be extended lower.
Trading Plan:
1. Buy on the current market price.
2. Sell if the price closes a (1d) candle under the 0.382 Fibonacci level (as September 19th).
Targets:
1. 15200 (little over Fibonacci 0.618).
2. 14600 (over Support).
Tips:
1. The Falling Wedge keeps the medium term bearish. We need a crossing over Resistance (1) to restore the long term bullish trend of 2023.
Please like, follow and comment!!
Notes:
Past trading plan:
Join our private Telegram signals channel, with +70% accuracy for forex and crypto! 🎉
Also doing account management, earn +15% monthly profit!
👉CONTACT: t.me/tradingbrokersview
Stop gambling with your trades! 🎰
Start being profitable! 💰
Also doing account management, earn +15% monthly profit!
👉CONTACT: t.me/tradingbrokersview
Stop gambling with your trades! 🎰
Start being profitable! 💰
Disclaimer
The information and publications are not meant to be, and do not constitute, financial, investment, trading, or other types of advice or recommendations supplied or endorsed by TradingView. Read more in the Terms of Use.