Support and Resistance Levels:
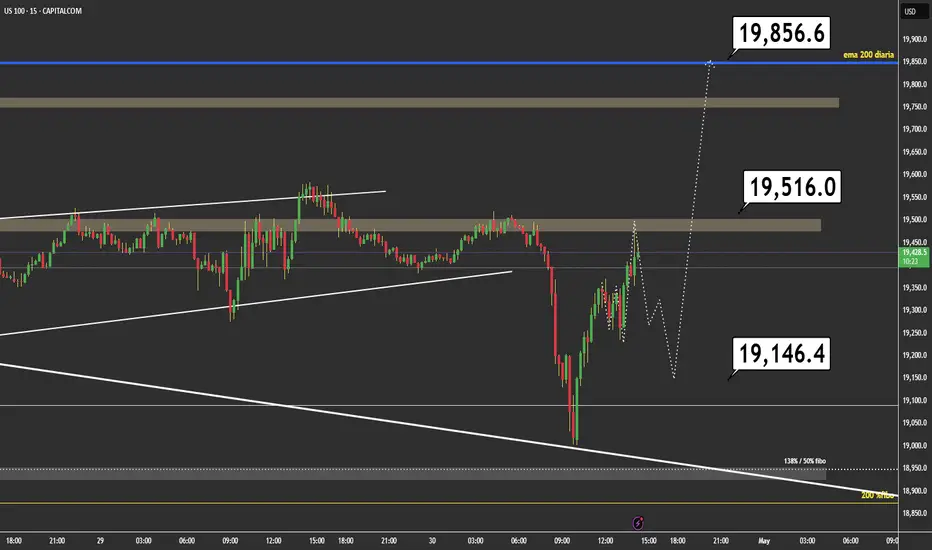
Resistance: 19,856.6 is a key level where the price has recently been rejected.
Support: 19,146.4 is a major support, with an intermediate level at 19,516.0 acting as a pivot point.
Trend and Structure:
The price has broken a descending trendline (white dotted line), suggesting a potential trend reversal from bearish to bullish.
Currently, the price is consolidating between 19,516.0 and 19,856.6, indicating indecision.
Indicators:
EMA 200 (Daily): The price is below the EMA 200 (19,856.0), indicating that the long-term trend remains bearish until the price sustains above this level.
Fibonacci: The 138% / 50% Fibonacci retracement level (18,950.0) has acted as support in the recent past.
Bullish Scenario:
If the price breaks and holds above 19,516.0 with volume, it could target the resistance at 19,856.6.
A confirmed break above 19,856.6 (with a close above the EMA 200) could signal bullish momentum toward 20,000 or higher.
Bearish Scenario:
If the price fails to hold above 19,516.0 and breaks lower, the next key support is at 19,146.4.
A drop below 19,146.4 could push the price toward 18,950.0 (Fibonacci level).
Recommendation:
Long Entry: Wait for a confirmed break above 19,516.0 with a strong close and volume. Target: 19,856.6. Stop-loss below 19,400.0.
Short Entry: If the price rejects 19,516.0, consider a short with a target at 19,146.4. Stop-loss above 19,600.0.
Monitor volume and price action near the EMA 200 for trend confirmation.
Note: This analysis is for informational purposes only and not financial advice. Adjust based on your strategy and risk management.
Disclaimer
The information and publications are not meant to be, and do not constitute, financial, investment, trading, or other types of advice or recommendations supplied or endorsed by TradingView. Read more in the Terms of Use.
Disclaimer
The information and publications are not meant to be, and do not constitute, financial, investment, trading, or other types of advice or recommendations supplied or endorsed by TradingView. Read more in the Terms of Use.