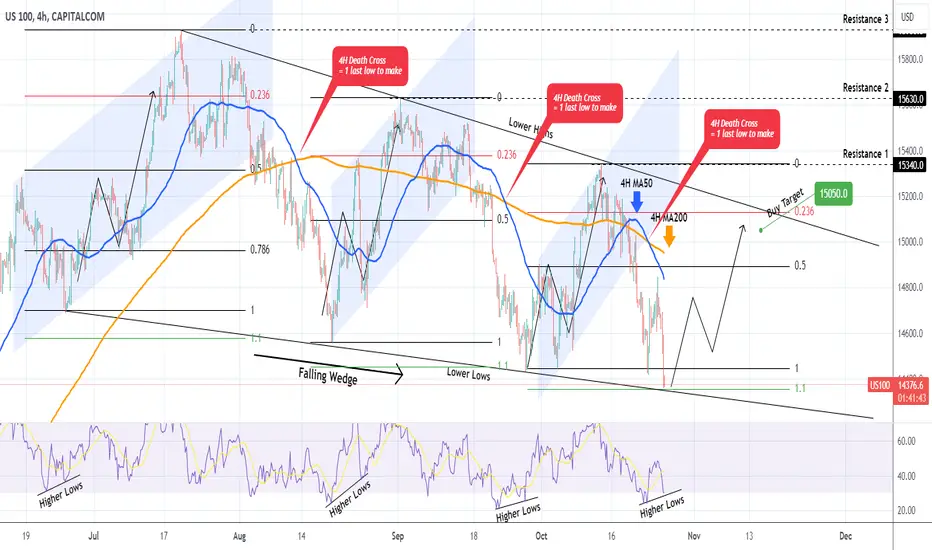
Nasdaq (NDX) gave us a low risk sell trade last week (see chart below), where after taking the loss on the Channel Up bottom buy, we reversed to selling on the break-out and hit 14530:
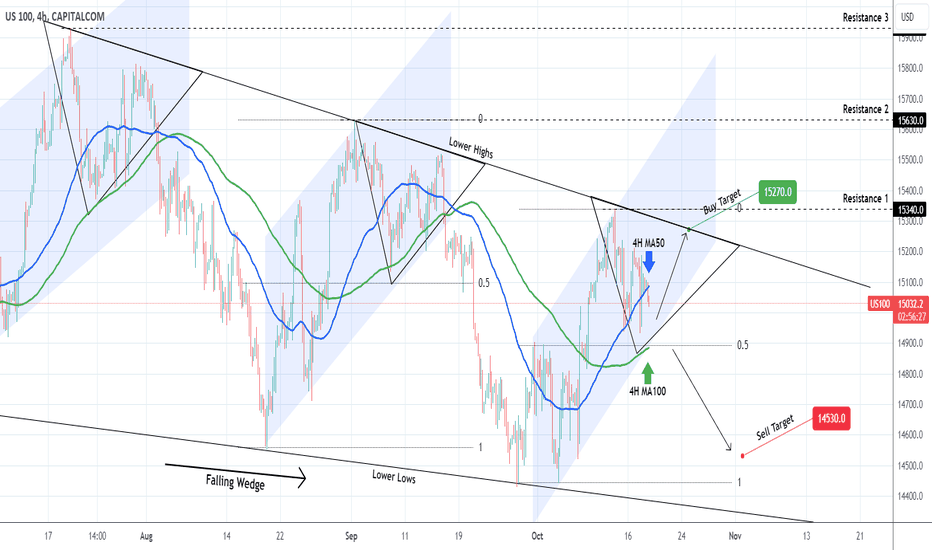
Standard 'buy low, sell the breakout if invalidated' approach that aims at assuming low risk near supports/ resistances and high return when those break.
This sell-off brought the price on the Lower Lows (bottom) trend-line of the Falling Wedge for the 4th time. Coming of a 4H Death Cross, this is the 2nd Low after its formation, which has previously been a bottom pricing and buy signal. Additionally, the 4H RSI has been on Higher Lows on every bottom. The last indication that this is a solid buy entry, is that the price hit the 1.1 Fibonacci extension (from previous Low to High), which was where the previous two bottoms where formed.
As a result of all the above parameters, we issue a buy signal on Nasdaq and since the previous Lower Highs almost hit the 0.236 Fibonacci level, we set the Target at 15050.
-------------------------------------------------------------------------------
** Please LIKE 👍, FOLLOW ✅, SHARE 🙌 and COMMENT ✍ if you enjoy this idea! Also share your ideas and charts in the comments section below! This is best way to keep it relevant, support us, keep the content here free and allow the idea to reach as many people as possible. **
-------------------------------------------------------------------------------
💸💸💸💸💸💸
👇 👇 👇 👇 👇 👇
👑Best Signals (Forex/Crypto+70% accuracy) & Account Management (+20% profit/month on 10k accounts)
💰Free Channel t.me/tradingshotglobal
🤵Contact info@tradingshot.com t.me/tradingshot
🔥New service: next X100 crypto GEMS!
💰Free Channel t.me/tradingshotglobal
🤵Contact info@tradingshot.com t.me/tradingshot
🔥New service: next X100 crypto GEMS!
Disclaimer
The information and publications are not meant to be, and do not constitute, financial, investment, trading, or other types of advice or recommendations supplied or endorsed by TradingView. Read more in the Terms of Use.