📊 US100 Technical Breakout: Bullish Triangle Resolution Above Key Trendline
🕒 Timeframe: 30-Minute
📌 Instrument: US100 – Nasdaq 100 Index
🗓 Published: June 22, 2025
---
🔍 Technical Breakdown:
This chart captures a beautiful confluence of technical structures that highlight market indecision resolving into a potential bullish continuation.
---
Key Elements of Analysis:
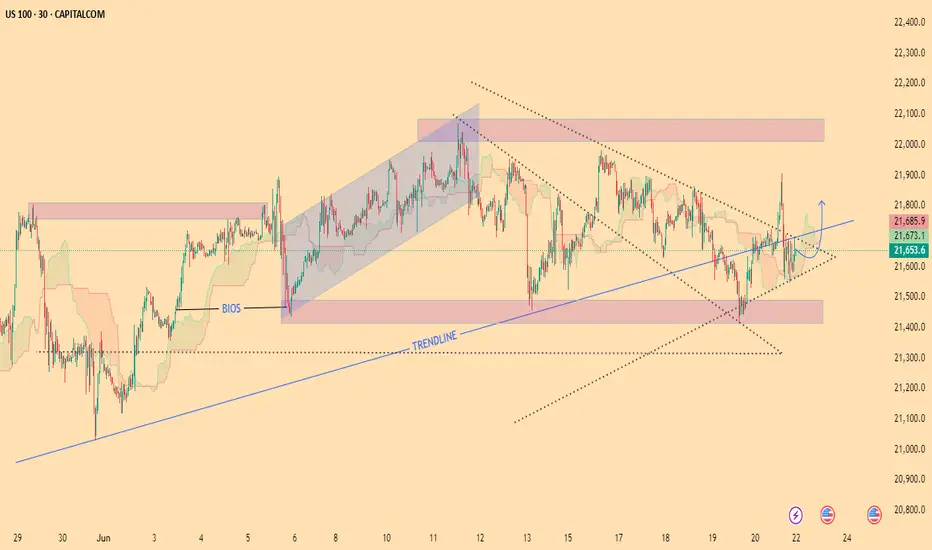
1. Ascending Trendline Support (in Blue):
A long-standing trendline dating back to early June has acted as dynamic support. Price respected this level consistently, suggesting strong bullish momentum beneath surface volatility.
2. Symmetrical Triangle Pattern (Dotted Lines):
Price has compressed within a symmetrical triangle, with lower highs and higher lows, indicating a potential volatility breakout.
The breakout has now occurred to the upside, suggesting a continuation of the broader bullish structure.
3. Bullish Order Block & BIOS Level:
Price previously broke structure (BIOS) to the upside and retested a key demand zone around 21,500–21,550, forming a solid order block base.
This acted as the launchpad for the breakout, highlighting institutional buying interest.
4. Channel Consolidation & Expansion:
A mid-phase consolidation in a bullish channel was observed, followed by healthy correction and a successful defense of the Ichimoku Cloud support, adding depth to the bullish conviction.
5. Reclaim of Key Resistance:
The price is attempting to reclaim 21,700+, a significant resistance zone. If held, this would validate the breakout and target the 22,000–22,100 zone (marked in red above), aligning with prior supply.
---
🎯 Potential Trade Idea:
Bullish Bias: Above 21,630, aiming for 21,900–22,100
Invalidation: Below 21,500, where trendline and demand zone would fail
---
🧠 Summary Insight:
This setup blends structural clarity with multi-timeframe alignment — triangle breakout, trendline respect, Ichimoku support, and institutional demand. The layered evidence creates a compelling case for bullish continuation.
Traders should watch for confirmation candle closes above 21,700, which would further strengthen the bullish narrative.
🕒 Timeframe: 30-Minute
📌 Instrument: US100 – Nasdaq 100 Index
🗓 Published: June 22, 2025
---
🔍 Technical Breakdown:
This chart captures a beautiful confluence of technical structures that highlight market indecision resolving into a potential bullish continuation.
---
Key Elements of Analysis:
1. Ascending Trendline Support (in Blue):
A long-standing trendline dating back to early June has acted as dynamic support. Price respected this level consistently, suggesting strong bullish momentum beneath surface volatility.
2. Symmetrical Triangle Pattern (Dotted Lines):
Price has compressed within a symmetrical triangle, with lower highs and higher lows, indicating a potential volatility breakout.
The breakout has now occurred to the upside, suggesting a continuation of the broader bullish structure.
3. Bullish Order Block & BIOS Level:
Price previously broke structure (BIOS) to the upside and retested a key demand zone around 21,500–21,550, forming a solid order block base.
This acted as the launchpad for the breakout, highlighting institutional buying interest.
4. Channel Consolidation & Expansion:
A mid-phase consolidation in a bullish channel was observed, followed by healthy correction and a successful defense of the Ichimoku Cloud support, adding depth to the bullish conviction.
5. Reclaim of Key Resistance:
The price is attempting to reclaim 21,700+, a significant resistance zone. If held, this would validate the breakout and target the 22,000–22,100 zone (marked in red above), aligning with prior supply.
---
🎯 Potential Trade Idea:
Bullish Bias: Above 21,630, aiming for 21,900–22,100
Invalidation: Below 21,500, where trendline and demand zone would fail
---
🧠 Summary Insight:
This setup blends structural clarity with multi-timeframe alignment — triangle breakout, trendline respect, Ichimoku support, and institutional demand. The layered evidence creates a compelling case for bullish continuation.
Traders should watch for confirmation candle closes above 21,700, which would further strengthen the bullish narrative.
FREE FREE JOIN TELEGRAM FREE
🔗t.me/+ua3k8HySt11hNmU0
☑️ALL PAIRS SIGNALS
☑️XAUUSD AND CRYPTO SIGNALS
☑️DAILY 3-4 SIGNALS PROVIDE
🔗t.me/+ua3k8HySt11hNmU0
☑️ALL PAIRS SIGNALS
☑️XAUUSD AND CRYPTO SIGNALS
☑️DAILY 3-4 SIGNALS PROVIDE
Disclaimer
The information and publications are not meant to be, and do not constitute, financial, investment, trading, or other types of advice or recommendations supplied or endorsed by TradingView. Read more in the Terms of Use.