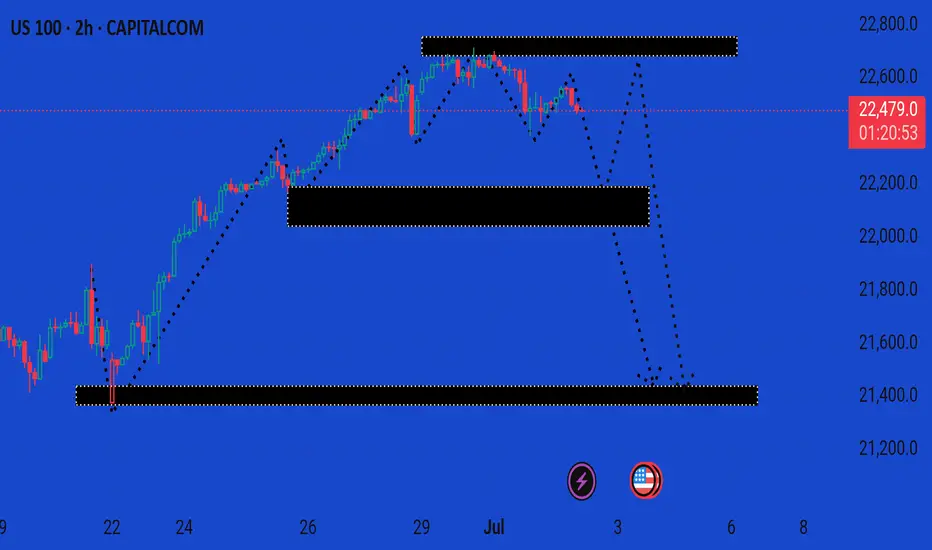
The chart you've shared is a 2-hour timeframe for the US 100 index (NASDAQ 100) with a clear bearish outlook marked by projected price levels and potential demand zones.
Key Observations:
1. Current Price:
22,478.5 (near-term consolidation with recent bearish pressure)
2. Highlighted Zones:
Resistance Zone: Around 22,750–22,800 — where price previously reversed.
First Demand Zone: Around 22,100–22,200 — potential support.
Second Demand Zone: Around 21,500–21,600 — deeper support level.
Third Major Demand Zone: Near 21,200 — long-term support.
3. Bearish Structure:
Price has broken below recent support levels.
Black dotted line shows a projected move toward lower demand zones.
Momentum appears to be weakening after a strong bullish rally from June 21–28.
4. Technical Bias:
This is a bearish correction or possible trend reversal setup.
The presence of strong demand zones suggests potential bounce zones if price reaches those levels.
---
Summary:
This chart implies a bearish move is underway on the US 100 with expected targets near 22,100, then 21,600, and potentially 21,200. Watch for bullish reaction or reversal signals at those zones. If price reclaims 22,800+, bearish outlook would be invalidated.
Let me know if you want a trade setup or confirmation strategy based on this analysis.
t.me/+EQ88IkMSUvQwMGJk
Join telegram channel free
t.me/+EQ88IkMSUvQwMGJk
Join telegram channel free
t.me/+EQ88IkMSUvQwMGJk
Disclaimer
The information and publications are not meant to be, and do not constitute, financial, investment, trading, or other types of advice or recommendations supplied or endorsed by TradingView. Read more in the Terms of Use.
t.me/+EQ88IkMSUvQwMGJk
Join telegram channel free
t.me/+EQ88IkMSUvQwMGJk
Join telegram channel free
t.me/+EQ88IkMSUvQwMGJk
Disclaimer
The information and publications are not meant to be, and do not constitute, financial, investment, trading, or other types of advice or recommendations supplied or endorsed by TradingView. Read more in the Terms of Use.