Description:
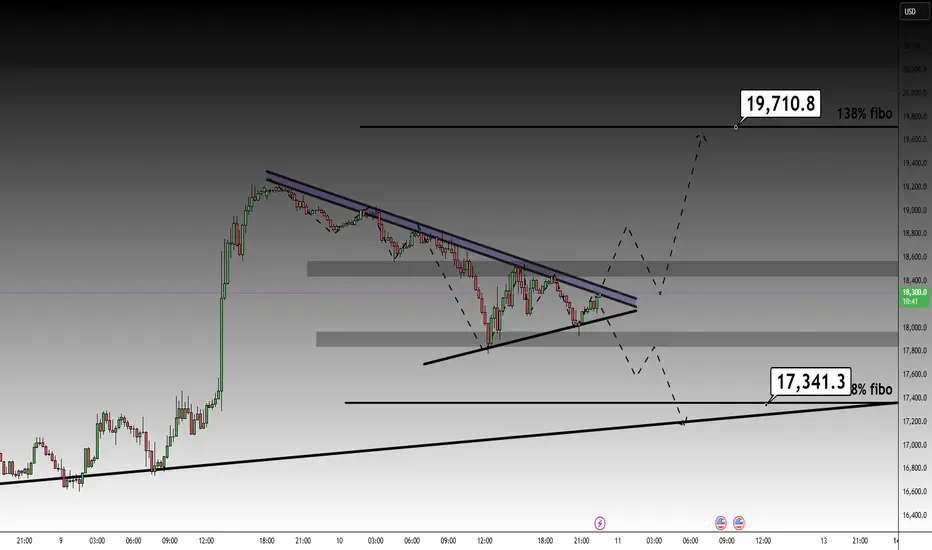
The NASDAQ 100 (NAS100) has formed a symmetrical triangle on the 15-minute timeframe, indicating a consolidation phase after a 5.4% drop. The price is near the triangle's apex, suggesting that a significant directional move is imminent. Here are the key levels and possible scenarios:
Bullish Scenario:
Entry: Breakout above 18,500 on volume.
Target: 19,710.8 (138% Fibonacci).
Stop Loss: 17,800.
R/R: 1:2.
Bearish Scenario:
Entry: Breakout below 17,800 on volume.
Target: 17,341.3 (138% Fibonacci).
Stop Loss: 18,300.
R/R: 1:1.5.
Key Levels:
Resistance: 19,710.8.
Support: 17,341.3.
Intermediate Zones: 18,500 (resistance) and 17,500 (support).
Considerations:
Monitor volume during the breakout to confirm the breakout.
Review macroeconomic events (interest rates, inflation data) and tech company earnings, as the NASDAQ is sensitive to these factors.
Technology market sentiment will be key in determining the direction.
Warning: Trade at your own risk and ensure you have an appropriate risk management plan. Share your opinion in the comments!
Tags: #NASDAQ #NAS100 #SymmetricTriangle #Breakout #TechnicalAnalysis
Trade active
Trade closed manually
Disclaimer
The information and publications are not meant to be, and do not constitute, financial, investment, trading, or other types of advice or recommendations supplied or endorsed by TradingView. Read more in the Terms of Use.
Disclaimer
The information and publications are not meant to be, and do not constitute, financial, investment, trading, or other types of advice or recommendations supplied or endorsed by TradingView. Read more in the Terms of Use.
