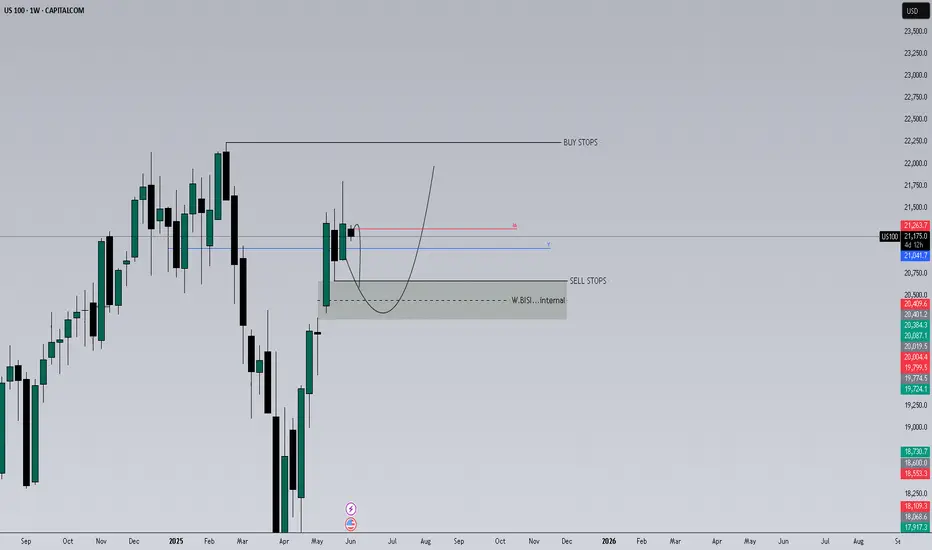
Price is showing signs of weakness after rejecting the 21,386 level, forming a potential shift in structure. Here's what I’m watching:
🔹 Context: After a bullish move in May, price is now stalling near previous highs.
🔸 Key Level: 21,386 marked as a potential rejection zone (also labeled as “Bullish”).
🔻 Scenario: If price stays below 21,386 and breaks the blue support (around 21,040), I expect continuation lower.
🟩 Discount Area: First demand zone between 20,000–20,500. Price could find support here if the bearish scenario plays out.
📌 ADR Levels included for volatility context.
🔄 Plan:
Wait for confirmation of rejection.
Target zone: 20,400–20,000.
Invalidation above 21,386 with bullish structure.
🧠 Bias: Bearish unless price reclaims 21,386 and holds.
📌 This is not financial advice – trade your plan.
Disclaimer
The information and publications are not meant to be, and do not constitute, financial, investment, trading, or other types of advice or recommendations supplied or endorsed by TradingView. Read more in the Terms of Use.
Disclaimer
The information and publications are not meant to be, and do not constitute, financial, investment, trading, or other types of advice or recommendations supplied or endorsed by TradingView. Read more in the Terms of Use.