US 10 YEAR TECHNICAL OUTLOOK FOR JUNE 2-6, 2025
Overnight, U.S. Treasuries remained stable, with shorter-dated maturities slightly outperforming longer ones. Mixed economic data included stronger-than-expected April personal income, weaker-than-expected May Chicago PMI, and concerns over U.S.-China trade tensions. Treasury Secretary Bessent noted stalled talks, while President Trump expressed frustration but optimism for resolution with President Xi. This supported stock market stabilization, with Treasury market stability aided by month-end rebalancing. The U.S. Dollar Index held steady at 99.33.
This week’s US economic calendar
Monday, June 2, 2025
• 9:45 AM: S&P Global Manufacturing PMI (May, Final)
• 10:00 AM: ISM Manufacturing PMI (May)
• 10:00 AM: Construction Spending (April)
• 10:15 AM: Fed’s Logan speaks at Eleventh District Banking Conference
• 12:45 PM: Fed’s Goolsbee speaks
Tuesday, June 3, 2025
• 10:00 AM: Factory Orders (April)
• 10:00 AM: JOLTS Job Openings (April)
• 1:00 PM: Treasury Auction: 3-Year Note
Wednesday, June 4, 2025
• 7:00 AM: MBA Mortgage Applications Index
• 8:15 AM: ADP Employment Change (May)
• 10:00 AM: ISM Services PMI (May)
• 10:00 AM: U.S. Trade Balance (April)
• 10:30 AM: EIA Crude Oil Inventories
• 1:00 PM: Treasury Auction: 10-Year Note
Thursday, June 5, 2025
• 8:30 AM: Initial and Continuing Jobless Claims
• 10:30 AM: EIA Natural Gas Inventories
Friday, June 6, 2025
• 8:30 AM: Nonfarm Payrolls (May)
• 8:30 AM: Unemployment Rate (May)
• 8:30 AM: Average Hourly Earnings (May)
• 3:00 PM: Consumer Credit (April)
Technical
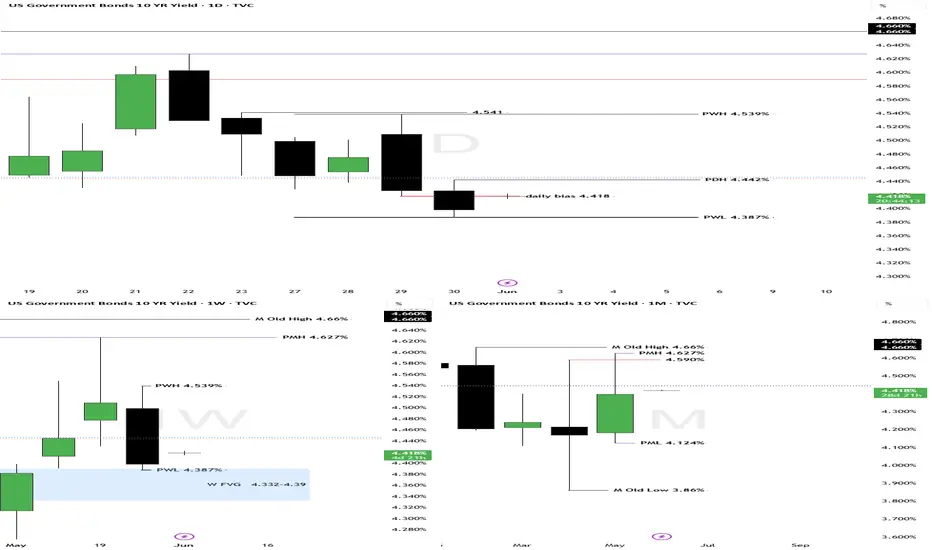
Monthly
The month of May ended closing inside Aprils range but taking note of the April highs sweep of 4.59%. my current support for June would be previous month’s high of 4.627% and old monthly high of 4.66%. Resistance would be 4.125% and old low of 3.86%.
Weekly
Weekly, I’m expecting previous week’s low of 4.387% sweep but also taking note of a possible resistance within the range of 4.39-4.332.
Daily
I’m anticipating a sweep of Fridays low of 4.387% while taking note of prev. day high of 4.442%
also our target last Friday of 4.418 was met.

DISCLAIMMER: This technical analysis is based on historical chart data, which may not predict future market outcomes. Any insights or interpretations I provide are for informational purposes only and should not be considered investment advice. Please conduct your own research and consult a qualified financial professional before making any investment decisions.
Overnight, U.S. Treasuries remained stable, with shorter-dated maturities slightly outperforming longer ones. Mixed economic data included stronger-than-expected April personal income, weaker-than-expected May Chicago PMI, and concerns over U.S.-China trade tensions. Treasury Secretary Bessent noted stalled talks, while President Trump expressed frustration but optimism for resolution with President Xi. This supported stock market stabilization, with Treasury market stability aided by month-end rebalancing. The U.S. Dollar Index held steady at 99.33.
This week’s US economic calendar
Monday, June 2, 2025
• 9:45 AM: S&P Global Manufacturing PMI (May, Final)
• 10:00 AM: ISM Manufacturing PMI (May)
• 10:00 AM: Construction Spending (April)
• 10:15 AM: Fed’s Logan speaks at Eleventh District Banking Conference
• 12:45 PM: Fed’s Goolsbee speaks
Tuesday, June 3, 2025
• 10:00 AM: Factory Orders (April)
• 10:00 AM: JOLTS Job Openings (April)
• 1:00 PM: Treasury Auction: 3-Year Note
Wednesday, June 4, 2025
• 7:00 AM: MBA Mortgage Applications Index
• 8:15 AM: ADP Employment Change (May)
• 10:00 AM: ISM Services PMI (May)
• 10:00 AM: U.S. Trade Balance (April)
• 10:30 AM: EIA Crude Oil Inventories
• 1:00 PM: Treasury Auction: 10-Year Note
Thursday, June 5, 2025
• 8:30 AM: Initial and Continuing Jobless Claims
• 10:30 AM: EIA Natural Gas Inventories
Friday, June 6, 2025
• 8:30 AM: Nonfarm Payrolls (May)
• 8:30 AM: Unemployment Rate (May)
• 8:30 AM: Average Hourly Earnings (May)
• 3:00 PM: Consumer Credit (April)
Technical
Monthly
The month of May ended closing inside Aprils range but taking note of the April highs sweep of 4.59%. my current support for June would be previous month’s high of 4.627% and old monthly high of 4.66%. Resistance would be 4.125% and old low of 3.86%.
Weekly
Weekly, I’m expecting previous week’s low of 4.387% sweep but also taking note of a possible resistance within the range of 4.39-4.332.
Daily
I’m anticipating a sweep of Fridays low of 4.387% while taking note of prev. day high of 4.442%
also our target last Friday of 4.418 was met.
DISCLAIMMER: This technical analysis is based on historical chart data, which may not predict future market outcomes. Any insights or interpretations I provide are for informational purposes only and should not be considered investment advice. Please conduct your own research and consult a qualified financial professional before making any investment decisions.
Note
US 10YRS TECHNICAL OUTLOOK June 3OVERNIGHT
Fundamentals dominated the market. Overnight, the 10-year Treasury yield rose to 4.44%, up 3.55 basis points, the 2-year yield remained at 3.98%, and the 30-year yield approached 4.89%. Treasuries faced a slight sell-off, driven by renewed tariff threats from President Trump on steel and aluminum, increasing market volatility. A new tax and spending bill fueled fiscal deficit concerns, pressuring long-term yields. Softer-than-expected PCE inflation data at 2.1% versus 2.2% bolstered expectations of Federal Reserve rate cuts, moderating yield increases.
Economic Releases
myfxbook.com/forex-economic-calendar
Technical for the day
4.382% - 4.412% zone marked last week is proving to be a technical resistance. We missed our target yesterday of Friday low of 4.387% citing more on fundamental catalysts that’s comminating the market – tariff. Today, I expect market to reach 4.47% yesterday’s high and making a bold call of 4.539% - 4.541% for the week. This is just a probability based on the price patterns I’m seeing. Resistance at 4.41% and 4.387%
Daily/Weekly/Monthly Chart
DISCLAIMMER: This technical analysis is based on historical chart data, which may not predict future market outcomes. Any insights or interpretations I provide are for informational purposes only and should not be considered investment advice. Please conduct your own research and consult a qualified financial professional before making any investment decisions.
Note
US 10YRS TECHNICAL OUTLOOK June 4Overnight
U.S. Treasuries saw strong demand in Asia futures trading, driven by a successful Japanese 10-year government bond sale and a weak China Caixin Manufacturing PMI (48.3, the lowest since 2022). However, gains reversed in the NY session following a 1.9% year-over-year Eurozone May CPI, reinforcing expectations for an ECB rate cut on Thursday, and an April JOLTS report indicating increased U.S. job openings, signaling labor market strength. Rising stock prices, nearing March highs, suggested potential asset reallocation, while a stronger U.S. dollar (Dollar Index +0.5% to 99.23) pressured the euro and yen.
June 4 Economic Releases
myfxbook.com/forex-economic-calendar
Daily Technical
Looking at the price action yesterday both Monday’s high and low were mitigated and closing inside the range. My bias today is neutral and waiting for more sign on direction considering Monday’s range. Watch out for any fundamental catalyst that can drive the market for direction.
Daily/Weekly/Monthly Chart
DISCLAIMMER: This technical analysis is based on historical chart data, which may not predict future market outcomes. Any insights or interpretations I provide are for informational purposes only and should not be considered investment advice. Please conduct your own research and consult a qualified financial professional before making any investment decisions.
Note
US 10YRS TECHNICAL OUTLOOK June 5Overnight
Treasuries rallied after a weaker-than-expected ADP Employment Change Report and a contractionary ISM Services PMI (49.9%) for May, raising growth concerns. This bolstered securities across the yield curve and fueled speculation of a 25-basis-point Fed rate cut by September. The U.S. Dollar Index fell 0.4% to 98.80 amid these concerns and declining interest rates.
June 5 Economic Releases
myfxbook.com/forex-economic-calendar
Daily Technical
Overnight price action backed by fundamental has been very strong triggering a bullish price action breaking resistance of 4.382%-4.412%. My daily bias is a continuation for the day possibly targeting 4.349% and taking note of a possible resistance zone of 4.335%-4.345%. Although please take note that Fridays employment data could be a catalyst.
DISCLAIMMER: This technical analysis is based on historical chart data, which may not predict future market outcomes. Any insights or interpretations I provide are for informational purposes only and should not be considered investment advice. Please conduct your own research and consult a qualified financial professional before making any investment decisions.
Daily/Weekly/Monthly Chart
Note
US 10YRS TECHNICAL OUTLOOK June 6Overnight
U.S. Treasuries saw modest Asian session buying, fading after economic data showed a 6.6% rise in Q1 unit labor costs and a sharp April trade deficit drop, boosting Q2 GDP forecasts. Presidents Trump and Xi agreed to resume talks. Concerns grew over the reconciliation bill, with some senators and Elon Musk opposing it. The ECB cut rates by 25 basis points, as expected. The U.S. Dollar Index held steady at 98.78.
Economic Release today
myfxbook.com/forex-economic-calendar
Daily Bias
Looking at weekly and daily chart I have noted possible resistance zones on both time frames with yield closing back 4.391% after it has taken out Wednesday low of 4.349% and previous week low of 4.387%.
My bias today taking out 4.402% and with a high impact news due today I’m also watching 4.468% and 4.474%. Watch how news could manipulate the liquidity area i.e. previous day high or low and previous week highs or lows. I would stay away prior to these news events.
DISCLAIMMER: This technical analysis is based on historical chart data, which may not predict future market outcomes. Any insights or interpretations I provide are for informational purposes only and should not be considered investment advice. Please conduct your own research and consult a qualified financial professional before making any investment decisions.
Daily/Weekly/Monthly Chart
Disclaimer
The information and publications are not meant to be, and do not constitute, financial, investment, trading, or other types of advice or recommendations supplied or endorsed by TradingView. Read more in the Terms of Use.
Disclaimer
The information and publications are not meant to be, and do not constitute, financial, investment, trading, or other types of advice or recommendations supplied or endorsed by TradingView. Read more in the Terms of Use.