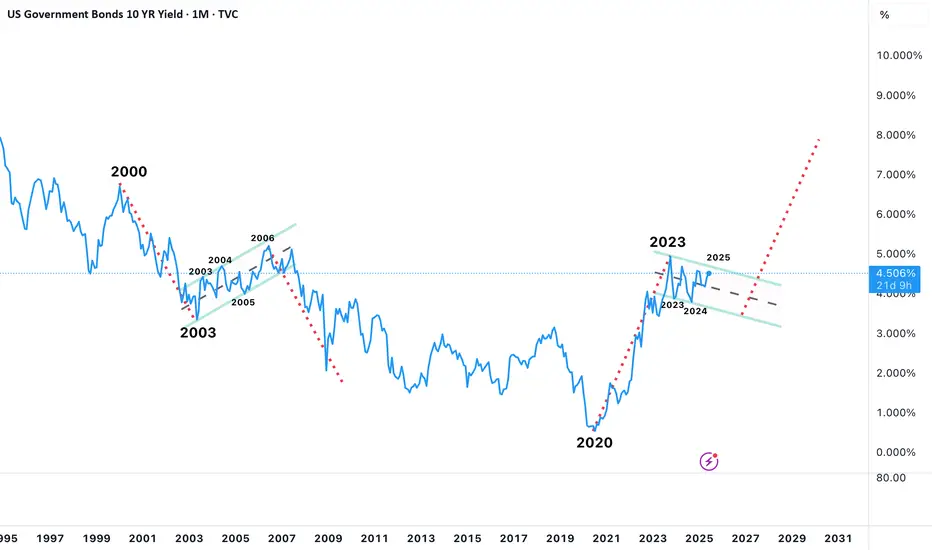
The monthly line chart is starting to look similar to the 2000-2008 timeframe; however instead of a prolonged Bear Flag; it looks like a prolonged Bull Flag in the making. Should that bull flag break to the upside; a doubling of the "pole" could put rates at or near the 8% range. (the dates rhyming could be just coincidental)
Note
Looking at RSI on the 12M line chart (below); it shows we have broken out from an RSI that was on a downward trajectory to one that is now on an upward trajectory. However, the upward trajectory is definitely not as steep as the trajectory was from 1940-1980.Note
The 12M line chart, adding Ichimoku (below), does suggest 8% in 2028 could be possible as there is plenty of "room to run". However I do think this only brings the red/orange lines close together and would not cause the red line to bullishly cross the orange line. In addition, there is no denying that the red cloud is rather large and in the very, very long term I just do not see this chart to be bullish really high rates like we had in the 1980's; however I do see the possibility of rates hovering around 8% as the "higher for longer" range.Disclaimer
The information and publications are not meant to be, and do not constitute, financial, investment, trading, or other types of advice or recommendations supplied or endorsed by TradingView. Read more in the Terms of Use.
Disclaimer
The information and publications are not meant to be, and do not constitute, financial, investment, trading, or other types of advice or recommendations supplied or endorsed by TradingView. Read more in the Terms of Use.