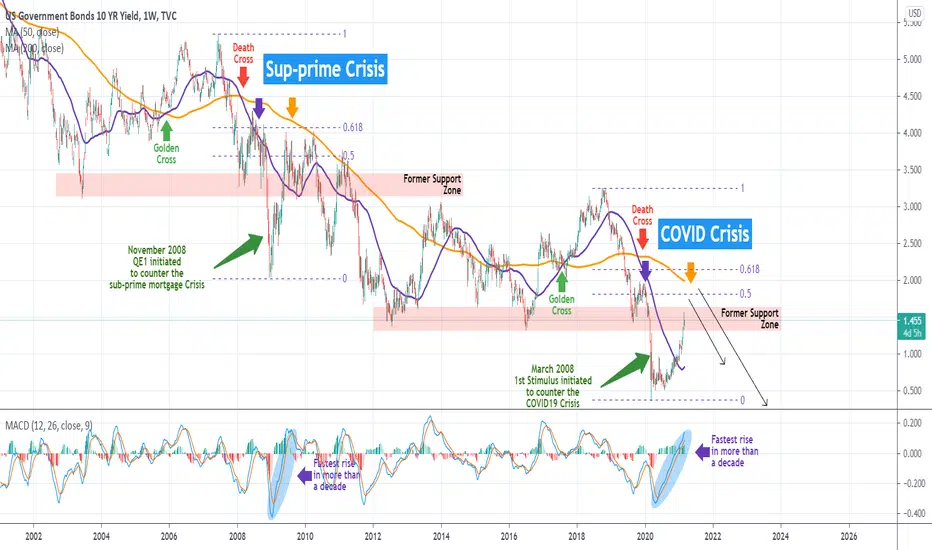
This study brings forward the similarities of today's price action on the U.S. Government Bonds 10YR Yield with 2008-2009 on the 1W time-frame.
* In 2008, the bottom was made shortly after the Quantitative Easing 1 (QE1) was initiated in order to offset the sub-prime mortgage Crisis. In 2020 the bottom was made shortly after the 1st Stimulus packaged was initiated in order to offset the COVID-19 Crisis.
* In 2009, the strong rebound that followed broke above the 1W MA50 (blue trend-line) but the MA200 (orange) held, emerging as a Resistance and eventually rejecting the price. So far today, the US10Y is way above the MA50 approaching the MA200.
* That rebound formed the fastest/ strongest 1W MACD rise in more than one decade on both periods.
* There is a Symmetrical Support Zone involved in both cases.
* A Golden Cross and a Death Cross preceded both periods.
Will history be repeated?
** Please support this idea with your likes and comments, it is the best way to keep it relevant and support me. **
--------------------------------------------------------------------------------------------------------
!! Donations via TradingView coins also help me a great deal at posting more free trading content and signals here !!
🎉 👍 Shout-out to TradingShot's 💰 top TradingView Coin donor 💰 this week ==> alanmasters
--------------------------------------------------------------------------------------------------------
👑Best Signals (Forex/Crypto+70% accuracy) & Account Management (+20% profit/month on 10k accounts)
💰Free Channel t.me/tradingshotglobal
🤵Contact info@tradingshot.com t.me/tradingshot
🔥New service: next X100 crypto GEMS!
💰Free Channel t.me/tradingshotglobal
🤵Contact info@tradingshot.com t.me/tradingshot
🔥New service: next X100 crypto GEMS!
Disclaimer
The information and publications are not meant to be, and do not constitute, financial, investment, trading, or other types of advice or recommendations supplied or endorsed by TradingView. Read more in the Terms of Use.