With the Federal Reserve’s rate decision in focus, I wanted to revise a previous idea that called for 6% on the 10 year T-bill, and provide a clearer read on what I’m seeing as the larger trend, which could provide important clues for the future of everything from monetary policy, to mortgage rates, and stocks.

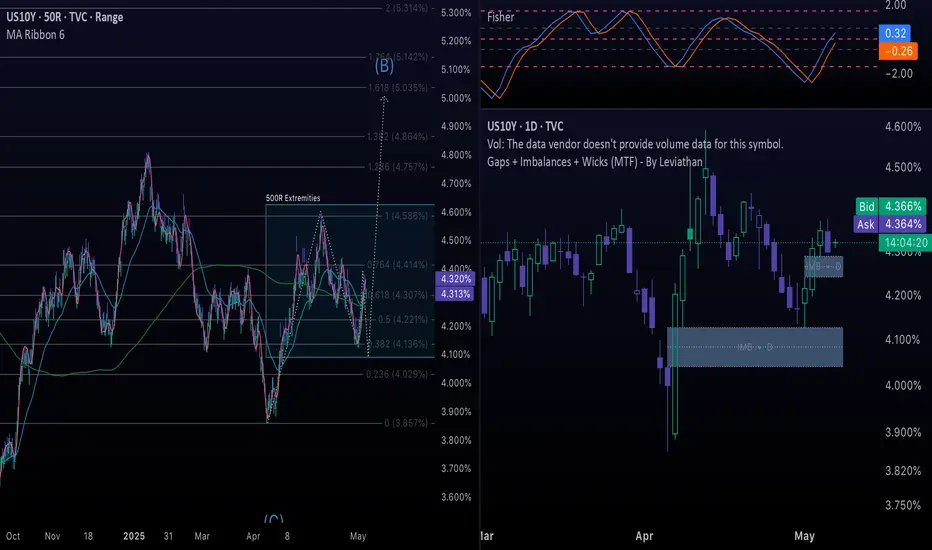
Starting with the 500R chart, I think we are seeing a clear flat correction form, with the current segment of the trend being Wave C of (B). In a flat correction, the endpoint of (B) should reach at least 100% of (A). It can also extend further or, in less common cases, only reach 90% of (A), however for the purposes of this idea I will assume the yield will retrace to the 100% level, which is just above 5%.
If this were to play out, it would suggest incoming pressure to financial markets that will eventually subside, likely later in the year. Something else to look for is that if this (B) wave were to fit a Zig Zag structure, that would cause waves (A) and (B) to be of the same pattern, so we should anticipate an alternate pattern in (C), such as a flat, diagonal, or triangle.

The question on everybody's mind at the moment is if/when the next interest rate cut is coming. For today's announcement, I expect there to be no surprises, which can also be supported by short term technicals.
Looking at the 100R chart (right) and Daily chart (left) at the same time provides useful context. The yield bounced off the 0.618 retracement of the 4/4 - 4/11 rise (labeled as 0.382 on the fib extension) and should have upward momentum. On the contrary, the Daily chart shows resistance at what appears to be a more well-defined lower high, with imbalances below. On the 100R chart, I also have a box drawn to show the extremities of the 500R bar. I expect the yield to move higher without creating a new 500R bar - which means the max low would be just below 4.10%.
A retracement to this level would lead to the yield hitting the middle line of the lower imbalance, which should be a key liquidity zone. From there, a move to the 1.618 extension would take the yield to the targeted 5%.
Something else I look for when detecting reversals is divergence on the Fisher Transform oscillator. I have it on both charts, which suggests a near-term move to the downside. Divergences are even more reliable on the Range charts, so a slightly lower low on the yield occurring while Fisher makes a higher low would signal that yields are about to rise higher.
Assuming we see similar action play out, this would support my fundamental prediction that FOMC will temporarily provide relief to the markets - possibly from there being no surprises or dovish comments on rate cuts. I would, however, expect this to be short lived. Since I am already calling for stocks to be near a major reversal level, I expect a sharp rise in bond yields to correspond with a more powerful sell off of stocks than what we saw in February-April. More likely catalysts could be hot CPI and/or failure of US/China trade talks.
Since there isn't much left to comment about on the technical side of things, I'll leave it at that. I ultimately expect the yield to start moving to 5%, so if it starts moving higher from here (4.36% currently), it would invalidate the idea that this will make one more push lower this week. We'll see what happens. Thank you for reading and let me know what you think!
Starting with the 500R chart, I think we are seeing a clear flat correction form, with the current segment of the trend being Wave C of (B). In a flat correction, the endpoint of (B) should reach at least 100% of (A). It can also extend further or, in less common cases, only reach 90% of (A), however for the purposes of this idea I will assume the yield will retrace to the 100% level, which is just above 5%.
If this were to play out, it would suggest incoming pressure to financial markets that will eventually subside, likely later in the year. Something else to look for is that if this (B) wave were to fit a Zig Zag structure, that would cause waves (A) and (B) to be of the same pattern, so we should anticipate an alternate pattern in (C), such as a flat, diagonal, or triangle.
The question on everybody's mind at the moment is if/when the next interest rate cut is coming. For today's announcement, I expect there to be no surprises, which can also be supported by short term technicals.
Looking at the 100R chart (right) and Daily chart (left) at the same time provides useful context. The yield bounced off the 0.618 retracement of the 4/4 - 4/11 rise (labeled as 0.382 on the fib extension) and should have upward momentum. On the contrary, the Daily chart shows resistance at what appears to be a more well-defined lower high, with imbalances below. On the 100R chart, I also have a box drawn to show the extremities of the 500R bar. I expect the yield to move higher without creating a new 500R bar - which means the max low would be just below 4.10%.
A retracement to this level would lead to the yield hitting the middle line of the lower imbalance, which should be a key liquidity zone. From there, a move to the 1.618 extension would take the yield to the targeted 5%.
Something else I look for when detecting reversals is divergence on the Fisher Transform oscillator. I have it on both charts, which suggests a near-term move to the downside. Divergences are even more reliable on the Range charts, so a slightly lower low on the yield occurring while Fisher makes a higher low would signal that yields are about to rise higher.
Assuming we see similar action play out, this would support my fundamental prediction that FOMC will temporarily provide relief to the markets - possibly from there being no surprises or dovish comments on rate cuts. I would, however, expect this to be short lived. Since I am already calling for stocks to be near a major reversal level, I expect a sharp rise in bond yields to correspond with a more powerful sell off of stocks than what we saw in February-April. More likely catalysts could be hot CPI and/or failure of US/China trade talks.
Since there isn't much left to comment about on the technical side of things, I'll leave it at that. I ultimately expect the yield to start moving to 5%, so if it starts moving higher from here (4.36% currently), it would invalidate the idea that this will make one more push lower this week. We'll see what happens. Thank you for reading and let me know what you think!
Disclaimer
The information and publications are not meant to be, and do not constitute, financial, investment, trading, or other types of advice or recommendations supplied or endorsed by TradingView. Read more in the Terms of Use.
Disclaimer
The information and publications are not meant to be, and do not constitute, financial, investment, trading, or other types of advice or recommendations supplied or endorsed by TradingView. Read more in the Terms of Use.