Folks know how I feel about very long term (multi year/decade+) outlook for inflation and yields - they are going higher.
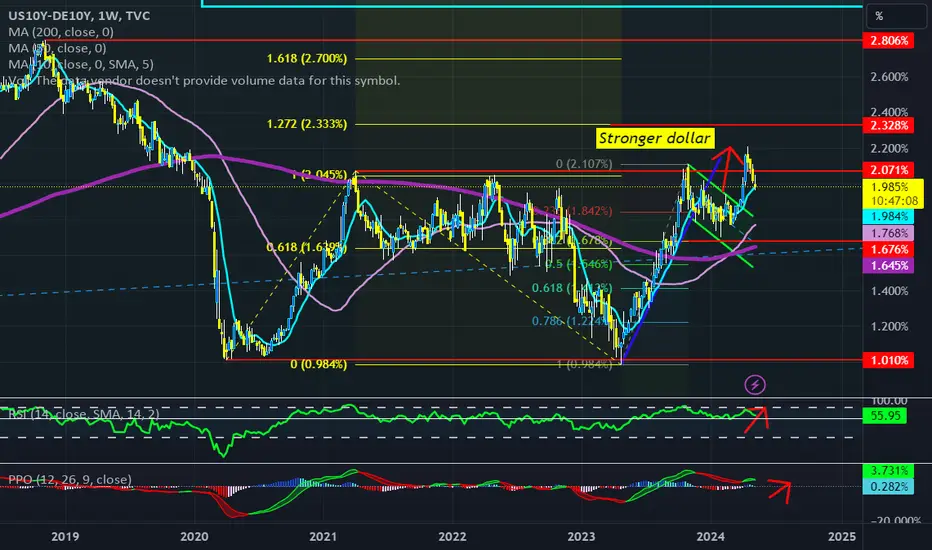
And I have called for higher yields (and spreads) and thus dollar so far this year.
BUT BUT BUT
The yield spread chart is suggesting a potential divergent high which could have MAJOR implications across asset markets. Is it fortelling a turn in the sequence of stronger US data? If so then in coming weeks/months we could see:
Weaker data
Lower yields (esp in the front end)
Curve "disinversion"
Weaker DXY
Higher risk assets = stonks, commods (gold silver, Uranium, oil etc), Bitcoin
Disclaimer
The information and publications are not meant to be, and do not constitute, financial, investment, trading, or other types of advice or recommendations supplied or endorsed by TradingView. Read more in the Terms of Use.
Disclaimer
The information and publications are not meant to be, and do not constitute, financial, investment, trading, or other types of advice or recommendations supplied or endorsed by TradingView. Read more in the Terms of Use.