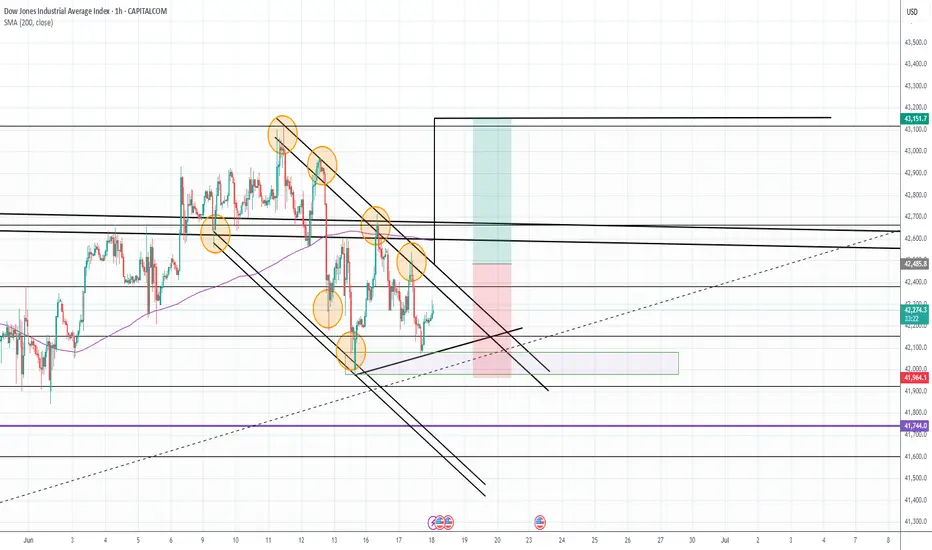
The US30 is currently forming a bullish flag on the 4H chart. A double bottom has developed around the 61.8% Fibonacci retracement level, measured from the most recent bullish impulse — providing a strong point of confluence that adds validity to the pattern.
Should price break above the flag's upper boundary, it could trigger a continuation to the upside, offering a potential long entry.
On the higher timeframes, the daily chart continues to respect a long-term ascending wedge, further supporting the bullish outlook and the possibility of a move towards new all-time highs.
Disclaimer
The information and publications are not meant to be, and do not constitute, financial, investment, trading, or other types of advice or recommendations supplied or endorsed by TradingView. Read more in the Terms of Use.
Disclaimer
The information and publications are not meant to be, and do not constitute, financial, investment, trading, or other types of advice or recommendations supplied or endorsed by TradingView. Read more in the Terms of Use.