The Dow Jones index has started the week with a strong bullish bias, pushing the price up by more than 1% in the short term. This upward trend has remained solid despite growing military tensions in the Middle East. While the conflict caused significant volatility last week, markets have now digested the uncertainty, with CNN’s Fear and Greed Index remaining steady in the “greed” zone, showing no signs of retreating toward neutral territory. This suggests that confidence remains firm in the short term, allowing demand for risk assets like the Dow Jones to stay consistent in recent sessions.
However, it is important to note that the Dow has historically shown significant sensitivity to trade war developments. Although ongoing negotiations between the United States and China continue, the outcome regarding tariffs remains uncertain. If no agreement is reached, negative trade dynamics could resurface, triggering a renewed loss of confidence and possibly leading to sustained selling pressure in the long term.
Consistent Bullish Trend
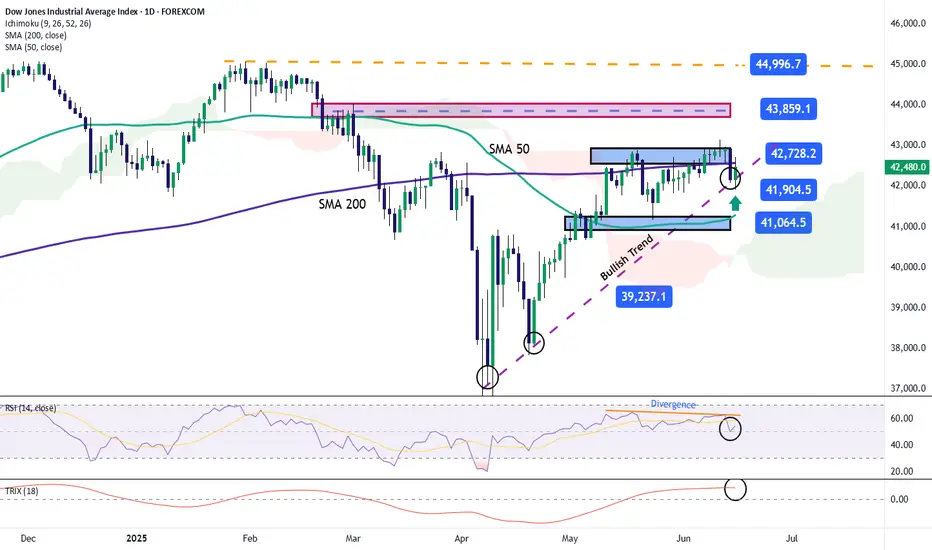
Since early April, the Dow Jones has maintained a strong buying trend, with price movements consistently above the 40,000-point level. So far, there have been no major bearish corrections that would break this structure. However, the price is currently facing a key resistance level. If this barrier holds, it could mark the beginning of a corrective phase in the short term.
Technical Indicators:
RSI: The RSI line has begun to show a bearish divergence, as it records lower highs, while the Dow’s price posts higher highs. This reflects an imbalance in market forces, which may lead to short-term downside corrections.
TRIX: The TRIX line, which measures the momentum of exponential moving averages, remains above the neutral level (0), but has started to flatten, potentially signaling the beginning of a neutral phase, especially as the price tests resistance zones.
Key Levels to Watch:
Written by Julian Pineda, CFA – Market Analyst
Follow him at: @julianpineda25
However, it is important to note that the Dow has historically shown significant sensitivity to trade war developments. Although ongoing negotiations between the United States and China continue, the outcome regarding tariffs remains uncertain. If no agreement is reached, negative trade dynamics could resurface, triggering a renewed loss of confidence and possibly leading to sustained selling pressure in the long term.
Consistent Bullish Trend
Since early April, the Dow Jones has maintained a strong buying trend, with price movements consistently above the 40,000-point level. So far, there have been no major bearish corrections that would break this structure. However, the price is currently facing a key resistance level. If this barrier holds, it could mark the beginning of a corrective phase in the short term.
Technical Indicators:
RSI: The RSI line has begun to show a bearish divergence, as it records lower highs, while the Dow’s price posts higher highs. This reflects an imbalance in market forces, which may lead to short-term downside corrections.
TRIX: The TRIX line, which measures the momentum of exponential moving averages, remains above the neutral level (0), but has started to flatten, potentially signaling the beginning of a neutral phase, especially as the price tests resistance zones.
Key Levels to Watch:
- 42,700 points: A critical resistance zone, aligned with the 200-period simple moving average. A breakout above this level would strengthen the current bullish bias and help consolidate the uptrend.
- 41,900 points: A short-term support level, associated with a recent neutral zone. It could act as a barrier against downward corrections.
- 41,064 points: The final support, aligned with the 50-period simple moving average. A drop to this level could threaten the ongoing bullish trend.
Written by Julian Pineda, CFA – Market Analyst
Follow him at: @julianpineda25
Disclaimer
The information and publications are not meant to be, and do not constitute, financial, investment, trading, or other types of advice or recommendations supplied or endorsed by TradingView. Read more in the Terms of Use.
Disclaimer
The information and publications are not meant to be, and do not constitute, financial, investment, trading, or other types of advice or recommendations supplied or endorsed by TradingView. Read more in the Terms of Use.