US30 (Dow Jones) — Price Tests Key Fib Support with Breakdown Risk
Technical Outlook — 12 June, 2025
Current Market Condition:
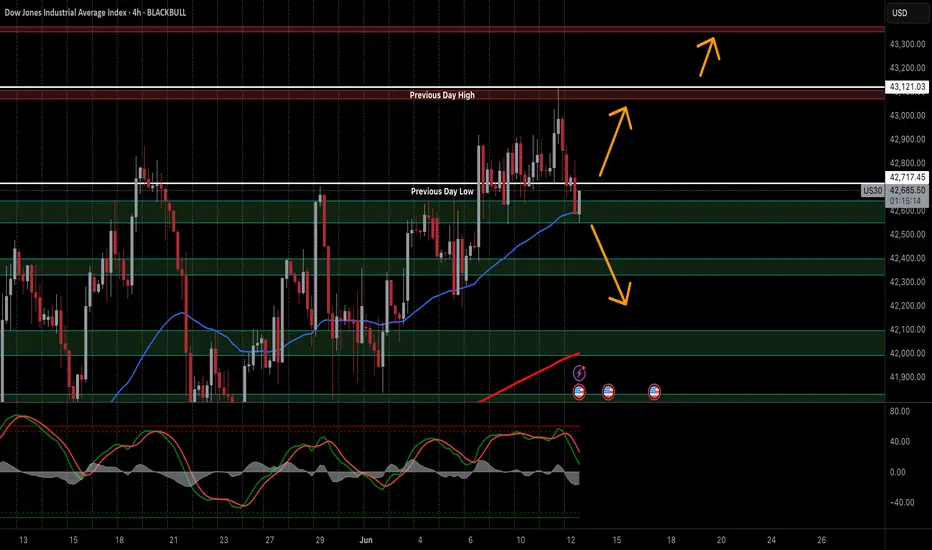
US30 (Dow Jones Industrial Average) is currently trading around 42,661 on the 4-hour timeframe, up +0.17% for the session. After rejection at the Previous Day High (43,121), price is now pulling back and testing the Previous Day Low around the 42,660 region, which also aligns with a Fibonacci confluence zone and the 50 EMA. This zone is acting as a last line of defence for bulls — if held, a push toward new highs remains on the table. However, a confirmed break could see the index slide further toward deeper support levels.
Key Technical Highlights:
Trade Plan:
✅ 1. Bullish Breakout (Long) – Most Probable if Support Holds
Trigger: Bullish candle or engulfing pattern above 42,660–42,700 zone with volume confirmation
Target: 43,121 (PDH) → 43,300
Stop Loss: Below 42,500
⚠️ 2. Bearish Rejection (Short) – Viable if Fib Zone Breaks
Trigger: 4H candle closes below 42,600 with bearish confirmation
Target: 42,300 → 42,100 → 41,900
Stop Loss: Above 42,800
📉 3. Dip Buy Setup – Least Probable but High RR Opportunity
Trigger: Price dips into 42,100 or 41,900 zone and forms a strong bullish reversal pattern (e.g., pin bar, bullish divergence on Stochastic)
Target: Bounce back toward 42,600–42,800
Stop Loss: Below 41,800
Risk Management:
Use conservative lot sizing and set clear stop losses to avoid whipsaw risk. With macroeconomic data and news expected this week, watch for volatility spikes. Always let the setup confirm before entry, especially near fib-based support or resistance zones.
📢 If you found this analysis valuable, kindly consider boosting and following for more updates.
⚠️ Disclaimer: This content is intended for educational purposes only and does not constitute financial advice.
Technical Outlook — 12 June, 2025
Current Market Condition:
US30 (Dow Jones Industrial Average) is currently trading around 42,661 on the 4-hour timeframe, up +0.17% for the session. After rejection at the Previous Day High (43,121), price is now pulling back and testing the Previous Day Low around the 42,660 region, which also aligns with a Fibonacci confluence zone and the 50 EMA. This zone is acting as a last line of defence for bulls — if held, a push toward new highs remains on the table. However, a confirmed break could see the index slide further toward deeper support levels.
Key Technical Highlights:
- Price is testing a major fib-based support cluster around 42,600–42,700, aligning with the Previous Day Low and 50 EMA.
- The Stochastic Oscillator has crossed bearish from the overbought region and is now heading down, indicating short-term bearish momentum.
- Resistance is now PDL and next one at 43,121 (PDH) and a break above this level would confirm bullish continuation.
Trade Plan:
✅ 1. Bullish Breakout (Long) – Most Probable if Support Holds
Trigger: Bullish candle or engulfing pattern above 42,660–42,700 zone with volume confirmation
Target: 43,121 (PDH) → 43,300
Stop Loss: Below 42,500
⚠️ 2. Bearish Rejection (Short) – Viable if Fib Zone Breaks
Trigger: 4H candle closes below 42,600 with bearish confirmation
Target: 42,300 → 42,100 → 41,900
Stop Loss: Above 42,800
📉 3. Dip Buy Setup – Least Probable but High RR Opportunity
Trigger: Price dips into 42,100 or 41,900 zone and forms a strong bullish reversal pattern (e.g., pin bar, bullish divergence on Stochastic)
Target: Bounce back toward 42,600–42,800
Stop Loss: Below 41,800
Risk Management:
Use conservative lot sizing and set clear stop losses to avoid whipsaw risk. With macroeconomic data and news expected this week, watch for volatility spikes. Always let the setup confirm before entry, especially near fib-based support or resistance zones.
📢 If you found this analysis valuable, kindly consider boosting and following for more updates.
⚠️ Disclaimer: This content is intended for educational purposes only and does not constitute financial advice.
Disclaimer
The information and publications are not meant to be, and do not constitute, financial, investment, trading, or other types of advice or recommendations supplied or endorsed by TradingView. Read more in the Terms of Use.
Disclaimer
The information and publications are not meant to be, and do not constitute, financial, investment, trading, or other types of advice or recommendations supplied or endorsed by TradingView. Read more in the Terms of Use.