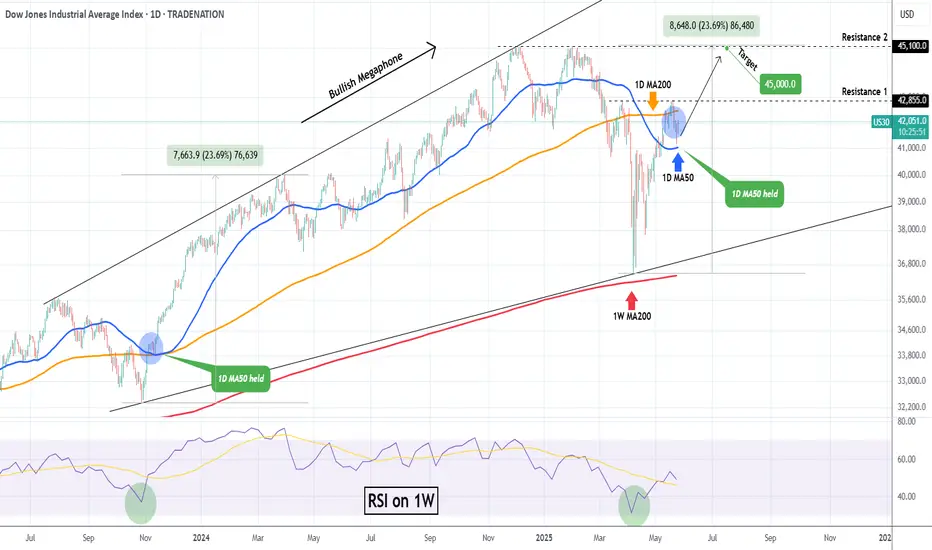
Dow Jones (DJI) contained Friday's Trump-led pull-back just above its 1D MA50 (blue trend-line), marking the strongest correction since April 21. So far that is purely a technical reaction to the Resistance 1 (42855) rejection a day earlier.
This is forming an Inverse Head and Shoulders (IH&S) but above all, as long as the 1D MA50 holds, it is a bullish continuation of April's rebound/ Bullish Leg at the bottom of the long-term Bullish Megaphone pattern and on the 1W MA200 (red trend-line).
As you can see, the 1W MA200 has been the ultimate Support of this pattern and last time it started a rebound that broke above the 1D MA50 and retested it, was on the first Bullish on November 09 2023.
That pull-back held the 1D MA50 and the price action continued the bullish trend until it completed a +23.69% rise, before the next 1D MA50 break.
As a result, as long as the 1D MA50 holds, we expect at least another +23.69% rise on the medium-term, which this times falls on the Resistance 2 level (45100), aligning perfectly for a technical test. Our Target will be a little lower at 45000.
-------------------------------------------------------------------------------
** Please LIKE 👍, FOLLOW ✅, SHARE 🙌 and COMMENT ✍ if you enjoy this idea! Also share your ideas and charts in the comments section below! This is best way to keep it relevant, support us, keep the content here free and allow the idea to reach as many people as possible. **
-------------------------------------------------------------------------------
Disclosure: I am part of Trade Nation's Influencer program and receive a monthly fee for using their TradingView charts in my analysis.
💸💸💸💸💸💸
👇 👇 👇 👇 👇 👇
👑Best Signals (Forex/Crypto+70% accuracy) & Account Management (+20% profit/month on 10k accounts)
💰Free Channel t.me/tradingshotglobal
🤵Contact info@tradingshot.com t.me/tradingshot
🔥New service: next X100 crypto GEMS!
💰Free Channel t.me/tradingshotglobal
🤵Contact info@tradingshot.com t.me/tradingshot
🔥New service: next X100 crypto GEMS!
Disclaimer
The information and publications are not meant to be, and do not constitute, financial, investment, trading, or other types of advice or recommendations supplied or endorsed by TradingView. Read more in the Terms of Use.