There are many bullish breakout patterns in the process.
On a larger scale there is an Inverse Head and Shoulders.
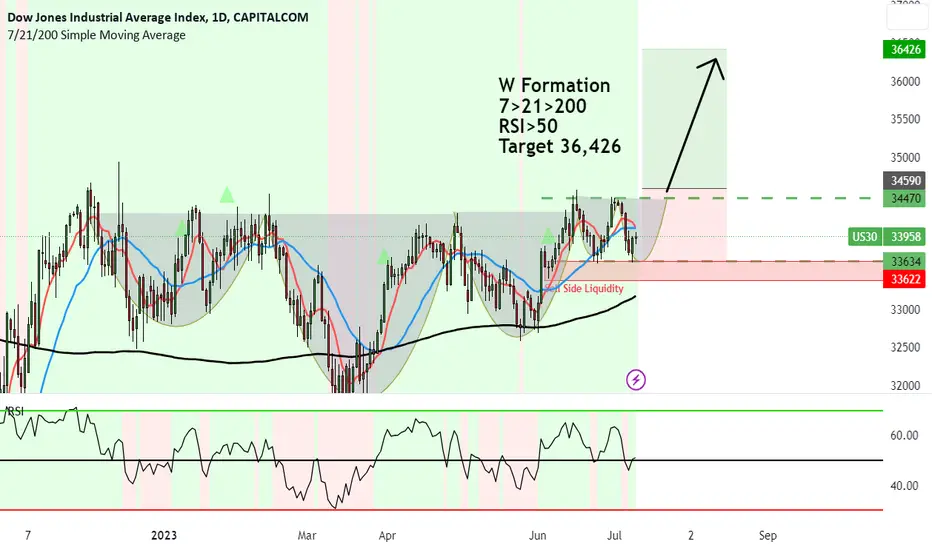
On a smaller scale, there is a Box Formation and a W Formation in the making.
We just need the price to break above and out of the formations, to get our confirmation.
Other indicators confirm including:
7>21>200
RSI>50
Target 36,426
SMC
Sell Side Liquidity is showing below the W Formation where Smart Money comes down and sweeps the selling from the retailers as they buy into it.
NOW WE WAIT!
On a larger scale there is an Inverse Head and Shoulders.
On a smaller scale, there is a Box Formation and a W Formation in the making.
We just need the price to break above and out of the formations, to get our confirmation.
Other indicators confirm including:
7>21>200
RSI>50
Target 36,426
SMC
Sell Side Liquidity is showing below the W Formation where Smart Money comes down and sweeps the selling from the retailers as they buy into it.
NOW WE WAIT!
✅ Facebook:
facebook.com/groups/matitrader
🌐Website:
timonandmati.com
𝕏 (Formerly Twitter):
twitter.com/timonr
Trade Well,
Timon Rossolimos
Founder, MATI Trader
(Pro trader since 2003)
facebook.com/groups/matitrader
🌐Website:
timonandmati.com
𝕏 (Formerly Twitter):
twitter.com/timonr
Trade Well,
Timon Rossolimos
Founder, MATI Trader
(Pro trader since 2003)
Disclaimer
The information and publications are not meant to be, and do not constitute, financial, investment, trading, or other types of advice or recommendations supplied or endorsed by TradingView. Read more in the Terms of Use.