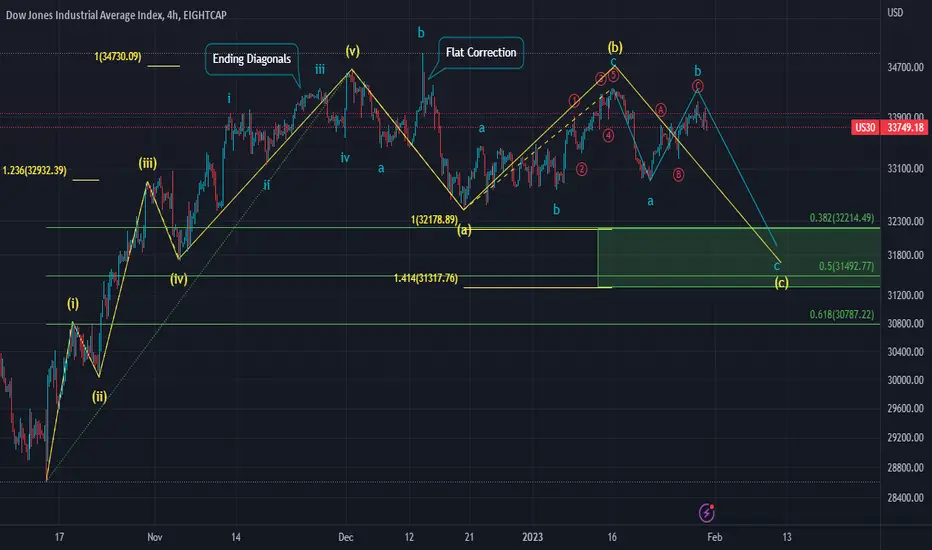
I have broken down the entire wave structure of the upward impulse which started in October 2022 up to today.
The chart is self explanatory and consist of my main wave count of US30 Index. Right now we are starting our Wave C of corrective cycle which is expected to bottom in the given range but the outlook can change depending on the upcoming news.
The chart is self explanatory and consist of my main wave count of US30 Index. Right now we are starting our Wave C of corrective cycle which is expected to bottom in the given range but the outlook can change depending on the upcoming news.
Related publications
Disclaimer
The information and publications are not meant to be, and do not constitute, financial, investment, trading, or other types of advice or recommendations supplied or endorsed by TradingView. Read more in the Terms of Use.
Related publications
Disclaimer
The information and publications are not meant to be, and do not constitute, financial, investment, trading, or other types of advice or recommendations supplied or endorsed by TradingView. Read more in the Terms of Use.
