DOW JONES Short term rise very likely
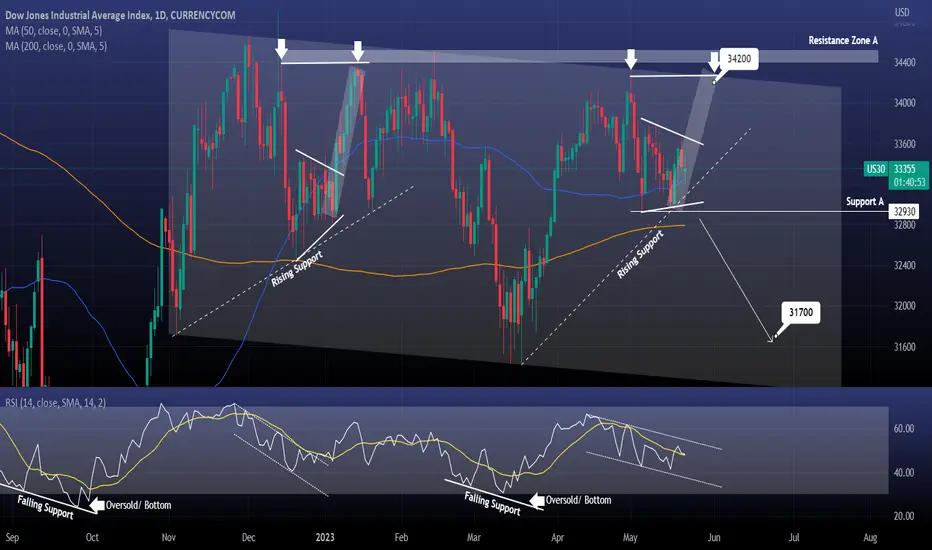
Dow Jones is finding support on the 1day MA50, forming a Triangle pattern.
The same pattern during the late December 2022 consolidation, broke upwards and reached the previous High.
Up to this point, even the 1day RSI structures since the Falling Supports are very much alike.
As long as Support A holds, buy and target 34200.
If it crosses under the 1day MA200, sell and target 31700.
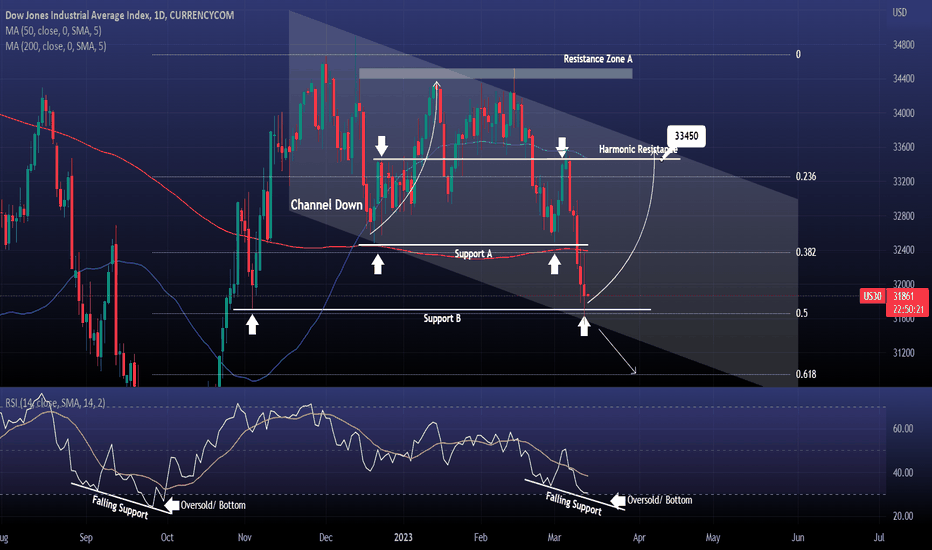
Previous chart:
Follow us, like the idea and leave a comment below!!
The same pattern during the late December 2022 consolidation, broke upwards and reached the previous High.
Up to this point, even the 1day RSI structures since the Falling Supports are very much alike.
As long as Support A holds, buy and target 34200.
If it crosses under the 1day MA200, sell and target 31700.
Previous chart:
Follow us, like the idea and leave a comment below!!
TheCryptagon offers news & insights on global markets (crypto, forex, stocks, commodities). Follow so you don't miss anything!
🤑Message us for private forex & crypto signals in our VIP channel (70% accuracy)!💰
TELEGRAM: t.me/thecryptagon
🤑Message us for private forex & crypto signals in our VIP channel (70% accuracy)!💰
TELEGRAM: t.me/thecryptagon
Disclaimer
The information and publications are not meant to be, and do not constitute, financial, investment, trading, or other types of advice or recommendations supplied or endorsed by TradingView. Read more in the Terms of Use.