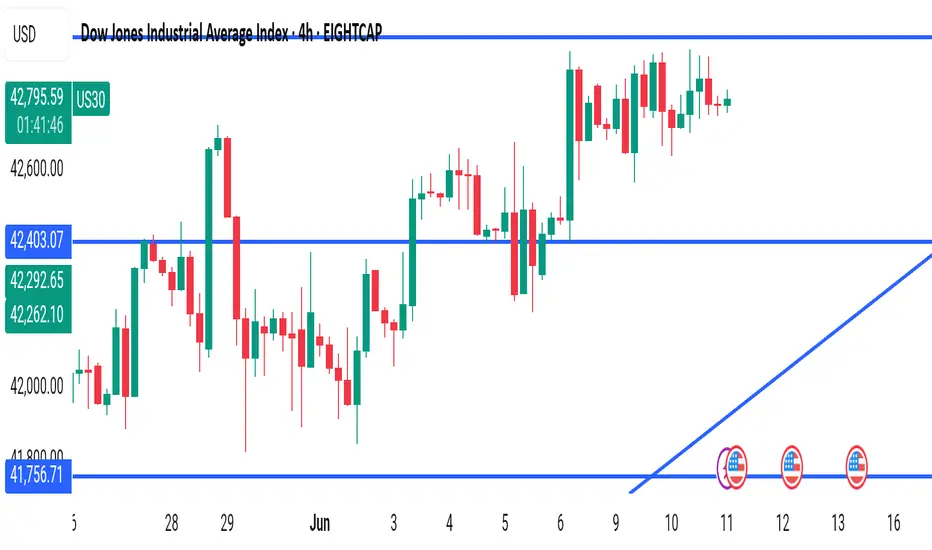
The Dow Jones is showing clear consolidation just below a major resistance level of 42,813 after a strong bullish rally earlier this month. Price action has been relatively choppy but continues to respect support zones and the rising trendline, suggesting a larger move is brewing.
🔹 Resistance:
42,813 (currently being tested – critical breakout zone)
Watch for candle closes above this level
🔹 Support Levels:
42,403.07 (mid-level pivot, acting as short-term support)
41,756.71 (key structural support)
Rising trendline (dynamic support zone into mid-June)
---
🔥 What the Chart Tells Us:
✅ Price is compressing near resistance with higher lows
✅ Strong demand around 42,262 and 42,292 zones
✅ Upcoming U.S. economic events (circled) could be the catalyst
✅ Volume and volatility expected to increase
---
💡 Possible Trading Scenarios:
📈 Bullish Breakout Setup:
A 4H candle close above 42,813 could trigger a momentum breakout, potentially targeting 43,000+.
📉 Bearish Rejection Setup:
Failure to break above may send price back to 42,400, and if broken, down to test 41,756 or the trendline.
---
📅 Upcoming U.S. Economic Data:
🟣 Marked on chart – keep your eyes on June 11, 12, and 13 for high-impact announcements!
---
📌 My Personal Bias:
Watching for a clean breakout with strong volume confirmation above 42,813. Patience is key here!
---
💬 What do YOU think?
Will the bulls break through or are we setting up for a pullback?
📝 Drop your analysis or setups below — Let’s grow together!
👍 Like & 🔔 Follow FrankFx14 for more market updates!
#US30 #DowJones #TechnicalAnalysis #TradingView #FrankFx14 #SupportAndResistance #BreakoutTrading #PriceAction #Forex #Indices #StockMarketAnalysis
✅JOIN FREE SIGNALS t.me/frankfxforextrade
✅FOR VIP DM: t.me/frankfx22
✅ AUTOMATED BOT: bot.frankfxx.com/
✅ICMARKETS frankfxx.com/icmarkets
✅ EXNESS frankfxx.com/exness
✅ XM frankfxx.com/xm
✅FOR VIP DM: t.me/frankfx22
✅ AUTOMATED BOT: bot.frankfxx.com/
✅ICMARKETS frankfxx.com/icmarkets
✅ EXNESS frankfxx.com/exness
✅ XM frankfxx.com/xm
Disclaimer
The information and publications are not meant to be, and do not constitute, financial, investment, trading, or other types of advice or recommendations supplied or endorsed by TradingView. Read more in the Terms of Use.