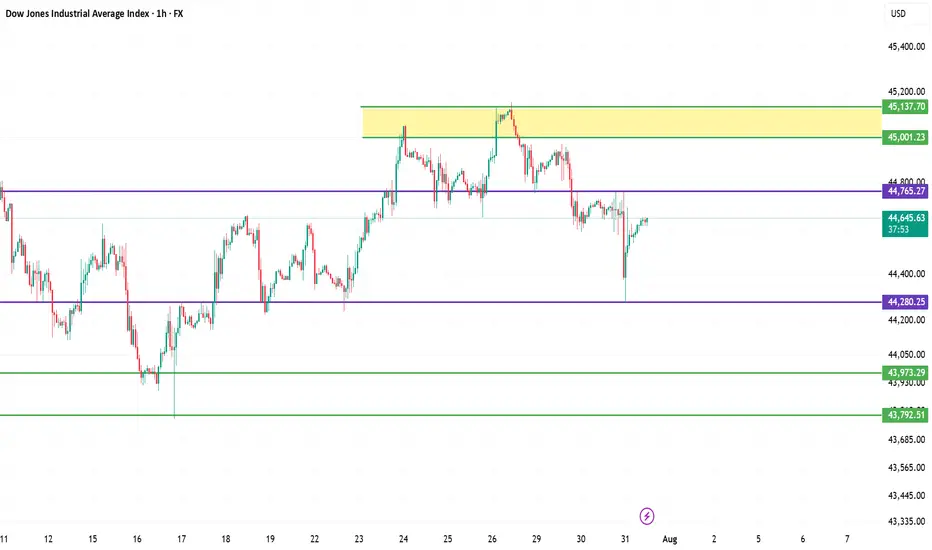
1. Structure: Broad Range Consolidation
Price remains within a wide horizontal range between 45,137 resistance and 43,792 support. This shows indecision and distribution at highs.
2. Key Rejection Zone
The yellow zone around 45,001–45,137 acted as a strong supply area. Multiple rejections indicate heavy selling interest here.
3. Mid-Zone Compression
Current price is hovering just below 44,765 resistance — acting as a decision point. Break above it may retest the supply zone; rejection could send price lower.
4. Demand Holding at 44,280
The strong bounce from 44,280.25 shows buyers defending this demand zone. It's the key support to watch for bulls.
5. Next Play
Bullish: Break and hold above 44,765 targets 45,001–45,137.
Bearish: Failure leads to 44,280, then 43,973 → 43,792.
Neutral bias unless a clean breakout confirms direction.
Here is my Telegram channel user name you can Join for Free Analysis and signals t.me/XAUTraderSidS
Disclaimer
The information and publications are not meant to be, and do not constitute, financial, investment, trading, or other types of advice or recommendations supplied or endorsed by TradingView. Read more in the Terms of Use.