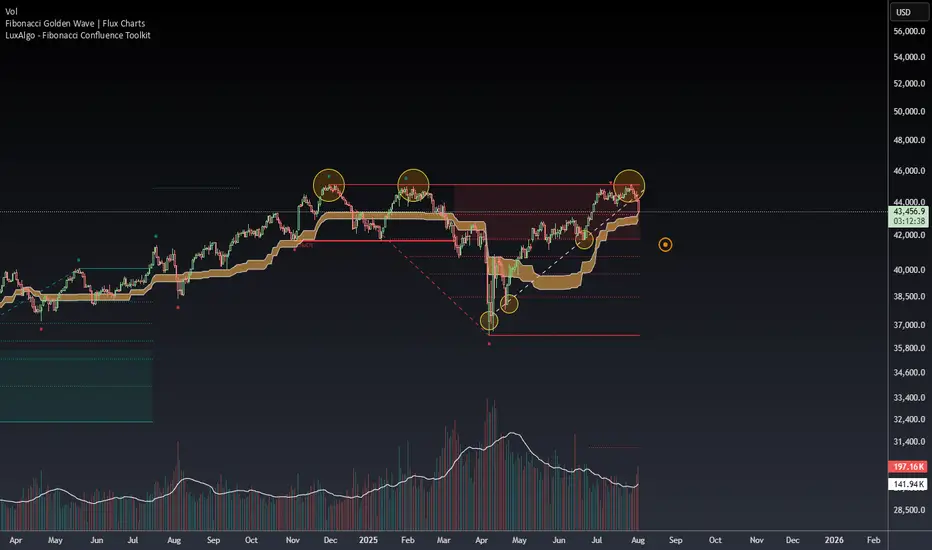
Potential Tripple Top formation spotted on the Dow. This would represent a full fibonacci retracement, which leads me to believe a 38.2 retest is likely. If this 23.6 level can hold support and price does not close below the fib band (orange channel), then the bullish continuation to new all time highs can still happen in Q3/Q4 of this year. The clear trendline break dating back to April is very concerning (white line), leading me to believe more downside in the coming weeks.
Let me know what you think in the comments!
Thanks
Let me know what you think in the comments!
Thanks
Related publications
Disclaimer
The information and publications are not meant to be, and do not constitute, financial, investment, trading, or other types of advice or recommendations supplied or endorsed by TradingView. Read more in the Terms of Use.
Related publications
Disclaimer
The information and publications are not meant to be, and do not constitute, financial, investment, trading, or other types of advice or recommendations supplied or endorsed by TradingView. Read more in the Terms of Use.