Dow Jones Industrial Average Index - 4h Chart (FOREXCOM)
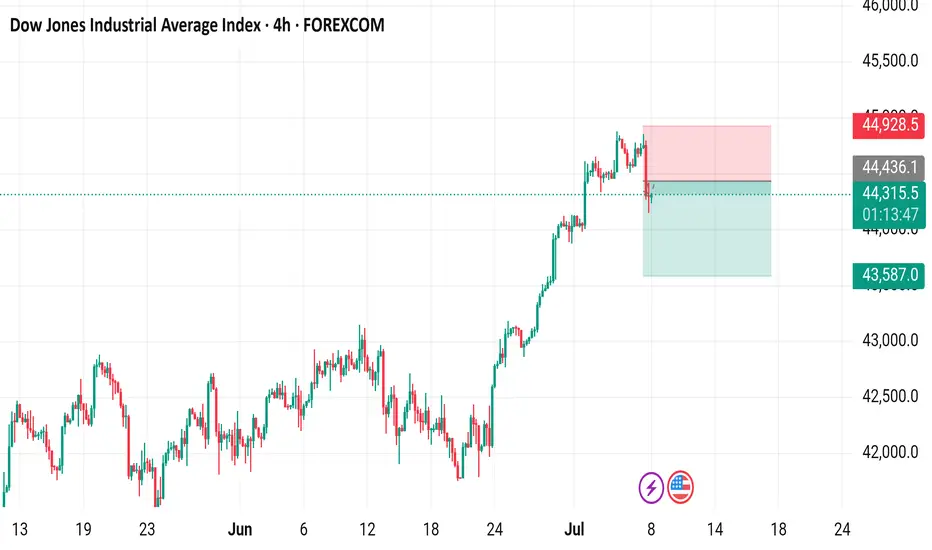
4-hour candlestick chart of the Dow Jones Industrial Average Index (US30) showing the price movement from late June to early July 2025. The current price is 44,314.0, with a slight increase of +23.0 (+0.05%). The chart includes buy and sell signals at 44,316.5 and 44,310.5 respectively, with highlighted resistance and support zones. The index has shown a general upward trend with some volatility over the period.
Trade closed manually
Target achieved on $44,148 it's a very long directions so close full now don't hold guy'sDaily XAU/USD FREE setups | Let's grow together!
| XAU/USD Trader | Telegram: https://t.me/Aleegoldsignals
| XAU/USD Trader | Telegram: https://t.me/Aleegoldsignals
Disclaimer
The information and publications are not meant to be, and do not constitute, financial, investment, trading, or other types of advice or recommendations supplied or endorsed by TradingView. Read more in the Terms of Use.
Daily XAU/USD FREE setups | Let's grow together!
| XAU/USD Trader | Telegram: https://t.me/Aleegoldsignals
| XAU/USD Trader | Telegram: https://t.me/Aleegoldsignals
Disclaimer
The information and publications are not meant to be, and do not constitute, financial, investment, trading, or other types of advice or recommendations supplied or endorsed by TradingView. Read more in the Terms of Use.