Short
DowJones/US30 Long-Term Bearish Correction?
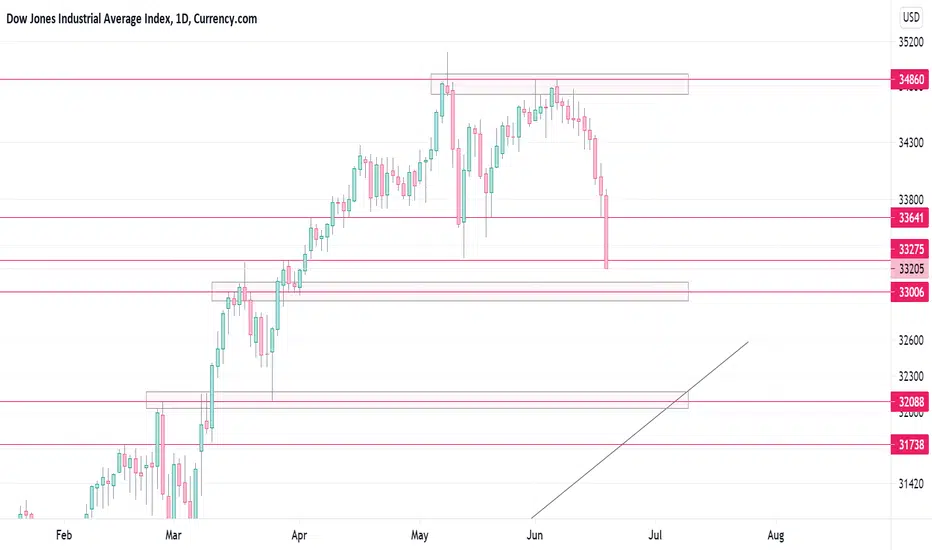
Analysis done on the daily timeframe.
If you look on the weekly TF, DJ is in a very clear uptrend but it hasn't had a major correction in a while now. I've drawn a trendline from the weekly which you can just about see on the chart (the black diagonal line), and i can see price heading down to it in the long-term. I have a few key S&R levels marked out, but what's important here are the pink S&D zones.
I see price coming down to the middle one ($33000), and then perhaps it will retrace upwards. However, if DJ ends up respecting the trendline we could very well see it come down to the bottom zone ($32100). That is quite a major drop but it could very well happen over time.
Alternatively we could see it drop to the middle zone and then bounce all the way back up to the ATH. I don't know, we shall have to wait and see.
Follow me for updates.
Note
Price has bounced up as expected from the middle zone. It's currently 800 points up but could easily keep heading upwards.Disclaimer
The information and publications are not meant to be, and do not constitute, financial, investment, trading, or other types of advice or recommendations supplied or endorsed by TradingView. Read more in the Terms of Use.
Disclaimer
The information and publications are not meant to be, and do not constitute, financial, investment, trading, or other types of advice or recommendations supplied or endorsed by TradingView. Read more in the Terms of Use.