Short
SHORT POSITION
US30;TECHNICAL
BEARISH:FORECAST
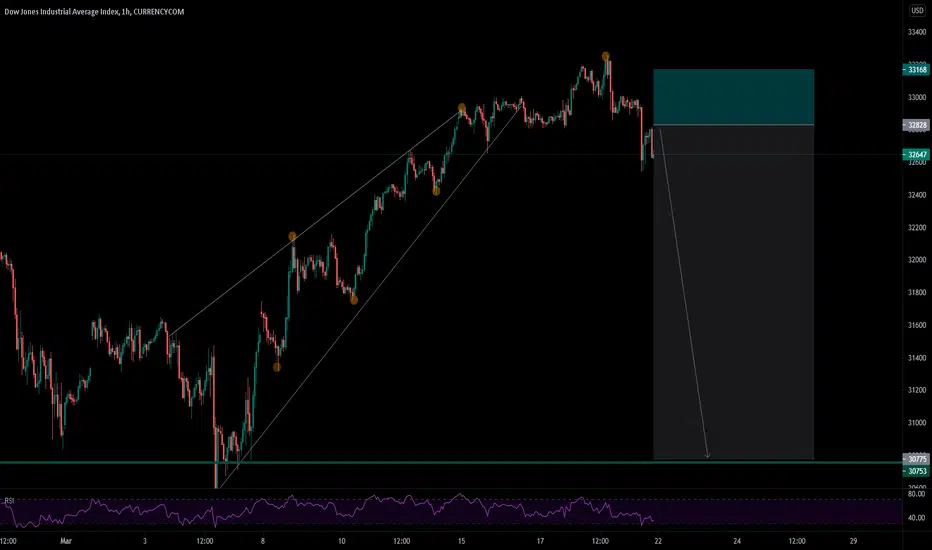
US30 (DOW) failure on breakout could lead to a sharp breakdown
The psychology of an ascending triangle failure
If a bearish breakout occurs, a 1200 point move lower is possible….
Is the breakout to new all-time highs in U.S. blue chip names cause for concern? It will be if certain developments begin to play out soon. Volatility has been low, complacency has set into a market where complacency looks as if it should be replaced with heightened alertness. Today, I am only going to take a look at one particular pattern in one index, however; there are multiple macro developments which at the very least raise caution flags that the entire ‘risk-trade’ could soon come under pressure. I recently went into greater detail on the subject – read here for more. Soon, I will revisit the topics in that article with some additions.
The US30 (DOW) has been coiling up into a wedge since the beginning of the year. Traders across all asset classes have felt this constriction in volatility, as price swings in everything from stocks to rates to commodities to FX have become increasingly smaller. To see that, all one needs to do is look at a daily chart of almost anything with the 10-day ATR indicator plotted at the bottom – average daily swings are dripping lower. The US30 during this triangulating process has witnessed nearly a 45% decline in daily price movement. If the following scenario occurs, it is very likely that bigger, maybe much bigger price movement will return.
On Monday, the US30 broke out to new all-time highs. How exciting, right? Not so fast…that breakout has already failed, for now at least, and we sit just about where we started the year. Why this fascinates me – when triangles, like the one the DOW is stuck in now, breakout and fall back into the pattern, it had better regain breakout levels soon or it is in real risk of breaking out in the opposite direction.
If you find this helpful and want more FREE Updates on TradingView
. . . . . Please show your support back,
. . . . . . . . Hit the 👍 LIKE button,
. . . . . . . . . . . Drop some feedback below in the comment!
❤️ Your Support is very much 🙏 appreciated! ❤️
💎 Want us to help you become a better Forex trader?
Now, It's your turn!
Be sure to leave a comment let us know how do you see this opportunity and forecast.
Trade well, ❤️
1_GFX English Support Team ❤️
BEARISH:FORECAST
US30 (DOW) failure on breakout could lead to a sharp breakdown
The psychology of an ascending triangle failure
If a bearish breakout occurs, a 1200 point move lower is possible….
Is the breakout to new all-time highs in U.S. blue chip names cause for concern? It will be if certain developments begin to play out soon. Volatility has been low, complacency has set into a market where complacency looks as if it should be replaced with heightened alertness. Today, I am only going to take a look at one particular pattern in one index, however; there are multiple macro developments which at the very least raise caution flags that the entire ‘risk-trade’ could soon come under pressure. I recently went into greater detail on the subject – read here for more. Soon, I will revisit the topics in that article with some additions.
The US30 (DOW) has been coiling up into a wedge since the beginning of the year. Traders across all asset classes have felt this constriction in volatility, as price swings in everything from stocks to rates to commodities to FX have become increasingly smaller. To see that, all one needs to do is look at a daily chart of almost anything with the 10-day ATR indicator plotted at the bottom – average daily swings are dripping lower. The US30 during this triangulating process has witnessed nearly a 45% decline in daily price movement. If the following scenario occurs, it is very likely that bigger, maybe much bigger price movement will return.
On Monday, the US30 broke out to new all-time highs. How exciting, right? Not so fast…that breakout has already failed, for now at least, and we sit just about where we started the year. Why this fascinates me – when triangles, like the one the DOW is stuck in now, breakout and fall back into the pattern, it had better regain breakout levels soon or it is in real risk of breaking out in the opposite direction.
If you find this helpful and want more FREE Updates on TradingView
. . . . . Please show your support back,
. . . . . . . . Hit the 👍 LIKE button,
. . . . . . . . . . . Drop some feedback below in the comment!
❤️ Your Support is very much 🙏 appreciated! ❤️
💎 Want us to help you become a better Forex trader?
Now, It's your turn!
Be sure to leave a comment let us know how do you see this opportunity and forecast.
Trade well, ❤️
1_GFX English Support Team ❤️
Disclaimer
The information and publications are not meant to be, and do not constitute, financial, investment, trading, or other types of advice or recommendations supplied or endorsed by TradingView. Read more in the Terms of Use.
Disclaimer
The information and publications are not meant to be, and do not constitute, financial, investment, trading, or other types of advice or recommendations supplied or endorsed by TradingView. Read more in the Terms of Use.