US30 (Dow Jones Index) — Clashing Forces of Risk & Reality
Technical Outlook — 16 June, 2025 | 1H Chart
Current Market Condition:
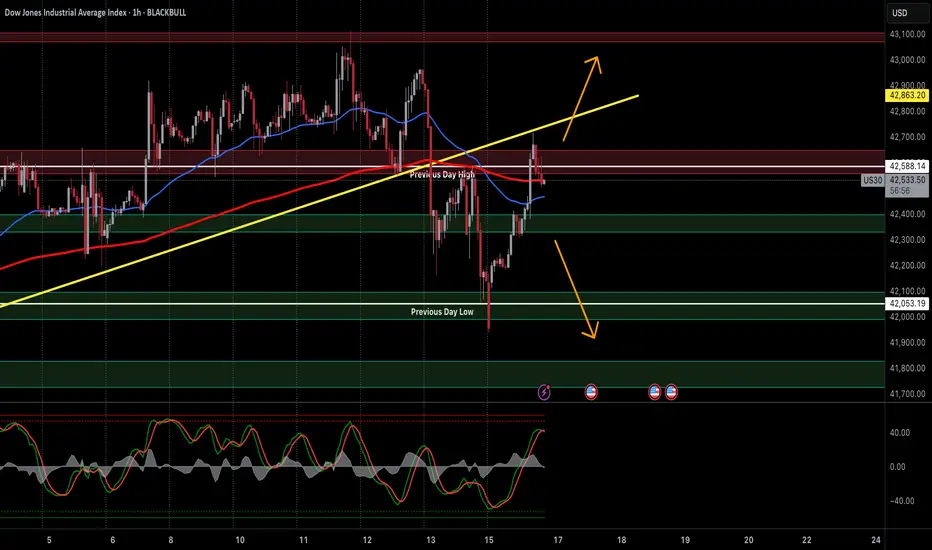
The Dow Jones (US30) has staged a recovery from the recent dip, but price is stalling at the Previous Day High (~42,588), a key confluence zone with the broken rising trendline, 50 EMA, and overhead supply.
This hesitation comes amid heightened global risk aversion triggered by the intensifying Iran–Israel conflict, adding pressure to global indices as investors rotate into safer assets like treasuries and gold. Despite intraday rebounds, equity bulls are showing signs of fatigue at resistance zones.
Markets are also bracing for upcoming US economic data and Fed commentary, which may further amplify intraday volatility.
Key Technical Highlights:
Trade Plan:
🔼 Bullish Breakout (Intraday Long):
Trigger: Break and sustained hold above 42,600 with rising volume
Target: 42,900 → 43,100
Stop Loss: Below 42,450 (to avoid whipsaws)
🔻 Bearish Rejection (Intraday Short):
Trigger: Clean rejection from PDH + trendline with bearish engulfing
Target: 42,100 → 42,050 → 41,850
Stop Loss: Above 42,650
⚖️ Neutral / Range Trade:
Play the range between PDH (~42,588) and PDL (~42,053) until breakout.
Scalp based on price reaction at either boundary with tight stop loss.
🛡️ Risk Management Note:
Global uncertainty tied to war escalation and Fed policy expectations make this a headline-driven market. News risk can spike volatility and invalidate technical setups. Trade with reduced size and increased caution, especially around US market open and geopolitical news cycles.
📢 If you found this analysis valuable, kindly consider boosting and following for more updates.
⚠️ Disclaimer: This content is intended for educational purposes only and does not constitute financial advice.
Technical Outlook — 16 June, 2025 | 1H Chart
Current Market Condition:
The Dow Jones (US30) has staged a recovery from the recent dip, but price is stalling at the Previous Day High (~42,588), a key confluence zone with the broken rising trendline, 50 EMA, and overhead supply.
This hesitation comes amid heightened global risk aversion triggered by the intensifying Iran–Israel conflict, adding pressure to global indices as investors rotate into safer assets like treasuries and gold. Despite intraday rebounds, equity bulls are showing signs of fatigue at resistance zones.
Markets are also bracing for upcoming US economic data and Fed commentary, which may further amplify intraday volatility.
Key Technical Highlights:
- Price rejected from the confluence of PDH (~42,588), horizontal supply zone, and old rising trendline (yellow).
- Currently hovering just under the 50 EMA; failure to hold could initiate a rotation back toward PD Low.
- Stochastic RSI nearing overbought — suggests possible local top if no momentum breakout follows.
- EMA 200 and the Previous Day Low at ~42,053 remain critical intraday supports.
- Overall structure forming potential lower high under bearish macro cloud.
Trade Plan:
🔼 Bullish Breakout (Intraday Long):
Trigger: Break and sustained hold above 42,600 with rising volume
Target: 42,900 → 43,100
Stop Loss: Below 42,450 (to avoid whipsaws)
🔻 Bearish Rejection (Intraday Short):
Trigger: Clean rejection from PDH + trendline with bearish engulfing
Target: 42,100 → 42,050 → 41,850
Stop Loss: Above 42,650
⚖️ Neutral / Range Trade:
Play the range between PDH (~42,588) and PDL (~42,053) until breakout.
Scalp based on price reaction at either boundary with tight stop loss.
🛡️ Risk Management Note:
Global uncertainty tied to war escalation and Fed policy expectations make this a headline-driven market. News risk can spike volatility and invalidate technical setups. Trade with reduced size and increased caution, especially around US market open and geopolitical news cycles.
📢 If you found this analysis valuable, kindly consider boosting and following for more updates.
⚠️ Disclaimer: This content is intended for educational purposes only and does not constitute financial advice.
Disclaimer
The information and publications are not meant to be, and do not constitute, financial, investment, trading, or other types of advice or recommendations supplied or endorsed by TradingView. Read more in the Terms of Use.
Disclaimer
The information and publications are not meant to be, and do not constitute, financial, investment, trading, or other types of advice or recommendations supplied or endorsed by TradingView. Read more in the Terms of Use.