Long
Higher low on dow? With long legged Doji reversal?
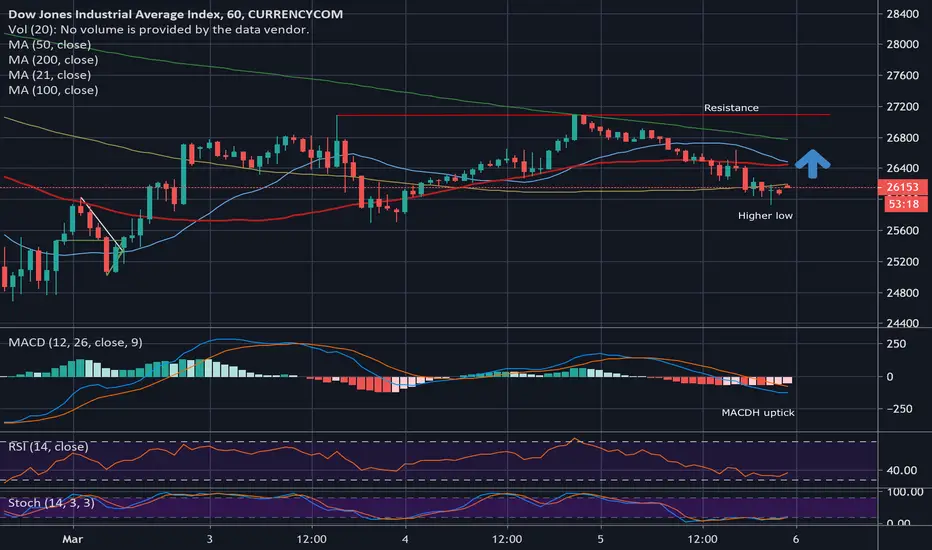
The dow has put in a higher low on the hourly chart. Combined with the long legged doji reversal pattern and MACDH uptick it looks like an OK long to take, considering the bullishness of the daily charts. We had a big gap down today so I would expect a gap fill tomorrow.
Decent trade with a stop just below the Doji, nice profit potential to test up to the resistance.
Decent trade with a stop just below the Doji, nice profit potential to test up to the resistance.
Disclaimer
The information and publications are not meant to be, and do not constitute, financial, investment, trading, or other types of advice or recommendations supplied or endorsed by TradingView. Read more in the Terms of Use.
Disclaimer
The information and publications are not meant to be, and do not constitute, financial, investment, trading, or other types of advice or recommendations supplied or endorsed by TradingView. Read more in the Terms of Use.