US30 H4
Technical Outlook — 11 June, 2025
Market Context:
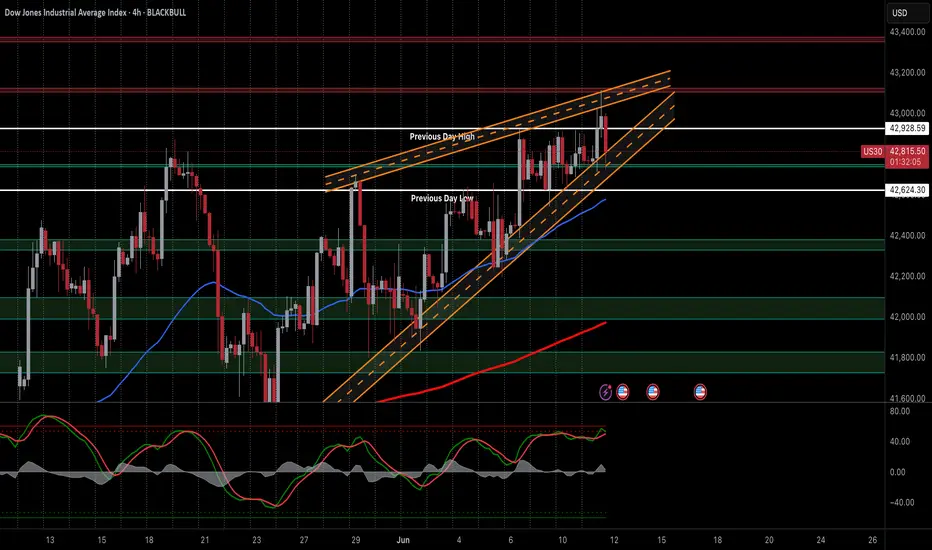
The Dow Jones (DJI) is currently consolidating around 42,730, forming a tight range near the "Previous Day High." Price action suggests a potential ascending triangle or consolidation pattern, indicating a crucial decision point for the short-term trend. The market is showing indecision at a key resistance cluster.
Key Levels & Trade Plan:
Resistance:
Immediate: ~$42,890 - $42,950 (Previous Day High / Upper consolidation boundary).
Major: ~$43,100 - $43,150.
Support:
Immediate: ~$42,700 - $42,750 (Lower consolidation boundary / Ascending trendline).
Strong: ~$42,545 - $42,600.
Lower/Previous Day Low: ~$42,280 - $42,390.
Trade Plan:
Bullish Breakout (Long):
Trigger: Clear 1-hour close above $42,950 with good volume.
Target: $43,100.
Stop Loss: Below breakout level (e.g., $42,850).
Bearish Breakdown (Short):
Trigger: Clear 1-hour close below $42,700 with strong selling volume.
Target: $42,600, then $42,390.
Stop Loss: Above breakdown level (e.g., $42,780).
Dip Buy (Long):
Trigger: Price holds $42,545 - $42,600 with bullish reversal.
Target: Resistance levels.
Stop Loss: Below the confirmed support.
Risk Management: Always use proper position sizing and set a stop loss.
If you found this analysis valuable, kindly consider boosting and following for more updates.
Disclaimer: This content is intended for educational purposes only and does not constitute financial advice.
Technical Outlook — 11 June, 2025
Market Context:
The Dow Jones (DJI) is currently consolidating around 42,730, forming a tight range near the "Previous Day High." Price action suggests a potential ascending triangle or consolidation pattern, indicating a crucial decision point for the short-term trend. The market is showing indecision at a key resistance cluster.
Key Levels & Trade Plan:
Resistance:
Immediate: ~$42,890 - $42,950 (Previous Day High / Upper consolidation boundary).
Major: ~$43,100 - $43,150.
Support:
Immediate: ~$42,700 - $42,750 (Lower consolidation boundary / Ascending trendline).
Strong: ~$42,545 - $42,600.
Lower/Previous Day Low: ~$42,280 - $42,390.
Trade Plan:
Bullish Breakout (Long):
Trigger: Clear 1-hour close above $42,950 with good volume.
Target: $43,100.
Stop Loss: Below breakout level (e.g., $42,850).
Bearish Breakdown (Short):
Trigger: Clear 1-hour close below $42,700 with strong selling volume.
Target: $42,600, then $42,390.
Stop Loss: Above breakdown level (e.g., $42,780).
Dip Buy (Long):
Trigger: Price holds $42,545 - $42,600 with bullish reversal.
Target: Resistance levels.
Stop Loss: Below the confirmed support.
Risk Management: Always use proper position sizing and set a stop loss.
If you found this analysis valuable, kindly consider boosting and following for more updates.
Disclaimer: This content is intended for educational purposes only and does not constitute financial advice.
Disclaimer
The information and publications are not meant to be, and do not constitute, financial, investment, trading, or other types of advice or recommendations supplied or endorsed by TradingView. Read more in the Terms of Use.
Disclaimer
The information and publications are not meant to be, and do not constitute, financial, investment, trading, or other types of advice or recommendations supplied or endorsed by TradingView. Read more in the Terms of Use.