Long
DOW JONES: Huge bullish breakout. Can target 35,900 this quarter
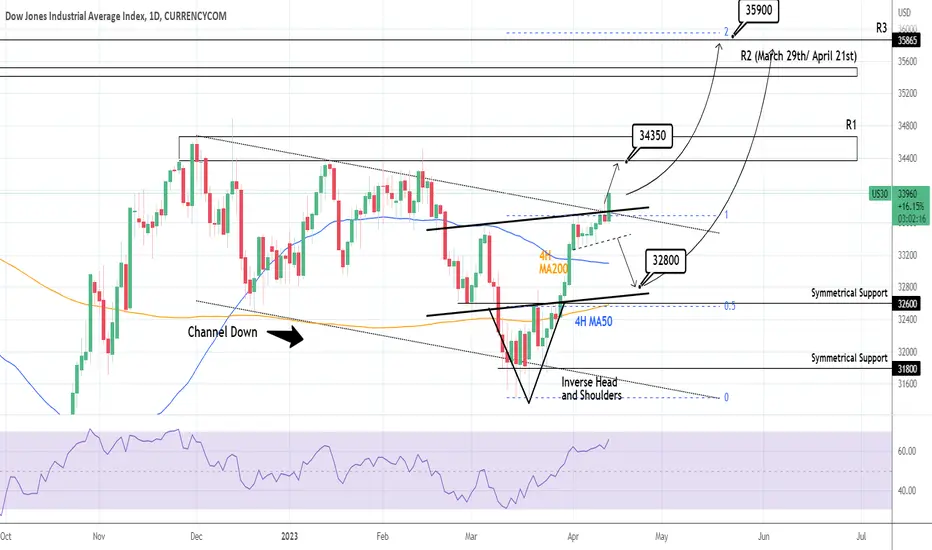
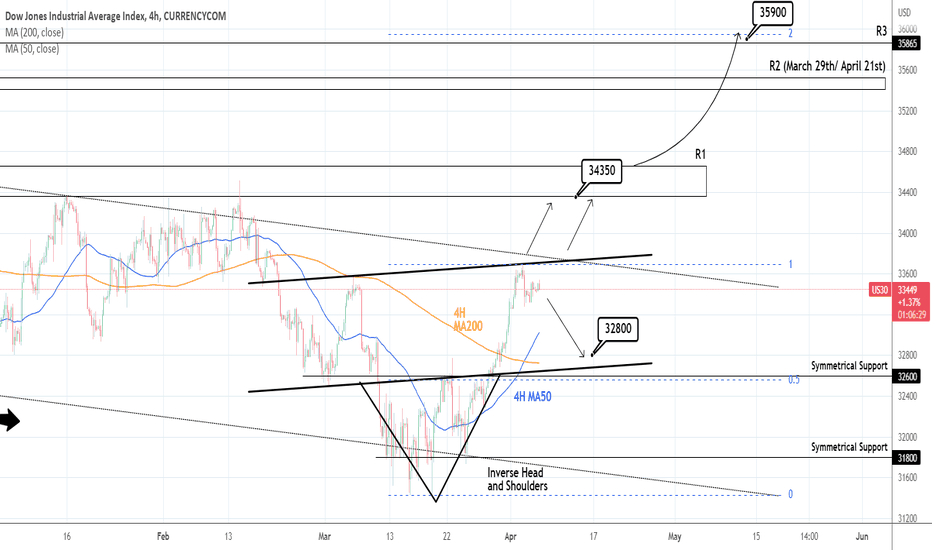
Dow Jones crossed above the long term Channel Down and turned technically bullish on the 1D timeframe (RSI = 66.042, MACD = 233.400, ADX = 55.323). Given that the bottom pattern was an Inverse Head and Shoulders, which was something we pointed out previously (see prior idea at the bottom), the new buying wave can take the price a lot higher than our short term target on R1 (TP = 34,350), even above R2 to Fibonacci 2.0 and R3 (TP = 35,900). The 1D RSI indicates that the index is on the biggest strength since late November.
Prior idea:
## If you like our free content follow our profile to get more daily ideas. ##
## Comments and likes are greatly appreciated. ##
Prior idea:
## If you like our free content follow our profile to get more daily ideas. ##
## Comments and likes are greatly appreciated. ##
Telegram: t.me/investingscope
investingscope.com
Over 65% accuracy on Private Signals Channel.
Over 15% return monthly on our Account Management Plan.
Account RECOVERY services.
Free Channel: t.me/investingscopeofficial
investingscope.com
Over 65% accuracy on Private Signals Channel.
Over 15% return monthly on our Account Management Plan.
Account RECOVERY services.
Free Channel: t.me/investingscopeofficial
Disclaimer
The information and publications are not meant to be, and do not constitute, financial, investment, trading, or other types of advice or recommendations supplied or endorsed by TradingView. Read more in the Terms of Use.