US30 Monthly, Weekly, and Daily Technical Analysis
Note: For educational purposes only. This is not financial advice.
Monthly Timeframe:
In April, the US30 (Dow Jones Industrial Average) posted a high of 42,548 and a low of 36,483. The April candle closed within the range of the March candle, signaling strong buying interest, likely driven by fundamental data. The key takeaway from the monthly chart is that April’s close within March’s range highlights buyer strength and the potential for continued bullish momentum.
Weekly Timeframe:
The bullish channel remains intact on the weekly timeframe. Although price briefly broke below the trendline, it quickly rebounded and re-entered the channel in the first week of April.
There has been no break of structure on the weekly chart. Last week's high at 42,858 swept the previous week’s high but closed within the previous week’s range, ending precisely at the prior week’s low. This indicates unclear price action and potential indecision.
If the upcoming week closes above the 43,100 level, this week’s low could be considered a weekly inducement, adding confluence for a potential bullish move. Until then, it remains just a weekly low without significant structure.
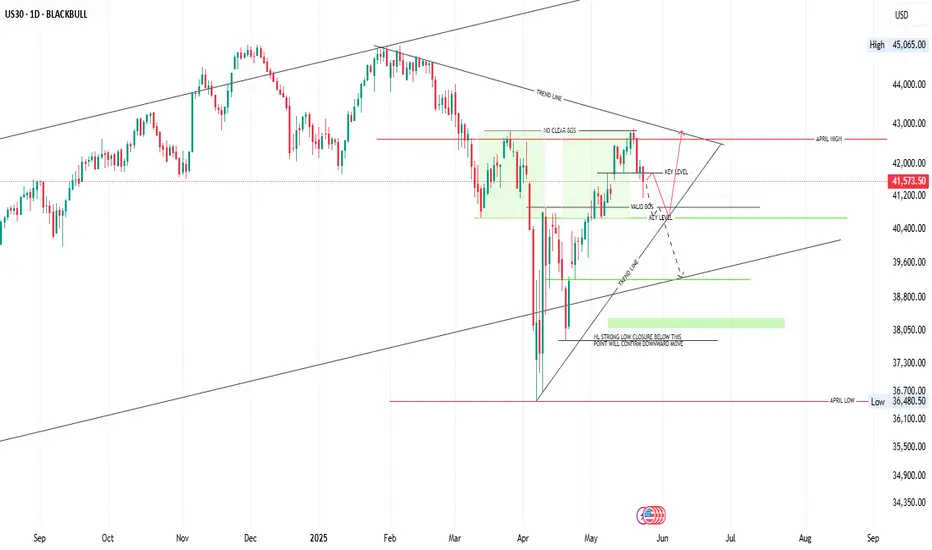
Daily Timeframe:
On the daily chart, price action remains indecisive, with no valid break of structure to confirm an upward trend continuation. However, there is a key support zone between 40,800 and 40,660, which aligns with a confluence of a daily trendline—potentially forming a buy zone, but only upon confirmation on lower timeframes.
Interestingly, the price has ranged between the same levels during the periods from March 13 to March 27 and from April 1 to May 20, reinforcing the range-bound nature of the market.
Outlook:
Given the lack of clear directional bias, scalping opportunities may be more appropriate in the upcoming week, especially if the market continues to range. A strong breakout and close above 43,150 could signal a bullish continuation, in which case we would look for a pullback and hold of long positions, targeting the 44,500 level.
Note: For educational purposes only. This is not financial advice.
Monthly Timeframe:
In April, the US30 (Dow Jones Industrial Average) posted a high of 42,548 and a low of 36,483. The April candle closed within the range of the March candle, signaling strong buying interest, likely driven by fundamental data. The key takeaway from the monthly chart is that April’s close within March’s range highlights buyer strength and the potential for continued bullish momentum.
Weekly Timeframe:
The bullish channel remains intact on the weekly timeframe. Although price briefly broke below the trendline, it quickly rebounded and re-entered the channel in the first week of April.
There has been no break of structure on the weekly chart. Last week's high at 42,858 swept the previous week’s high but closed within the previous week’s range, ending precisely at the prior week’s low. This indicates unclear price action and potential indecision.
If the upcoming week closes above the 43,100 level, this week’s low could be considered a weekly inducement, adding confluence for a potential bullish move. Until then, it remains just a weekly low without significant structure.
Daily Timeframe:
On the daily chart, price action remains indecisive, with no valid break of structure to confirm an upward trend continuation. However, there is a key support zone between 40,800 and 40,660, which aligns with a confluence of a daily trendline—potentially forming a buy zone, but only upon confirmation on lower timeframes.
Interestingly, the price has ranged between the same levels during the periods from March 13 to March 27 and from April 1 to May 20, reinforcing the range-bound nature of the market.
Outlook:
Given the lack of clear directional bias, scalping opportunities may be more appropriate in the upcoming week, especially if the market continues to range. A strong breakout and close above 43,150 could signal a bullish continuation, in which case we would look for a pullback and hold of long positions, targeting the 44,500 level.
Disclaimer
The information and publications are not meant to be, and do not constitute, financial, investment, trading, or other types of advice or recommendations supplied or endorsed by TradingView. Read more in the Terms of Use.
Disclaimer
The information and publications are not meant to be, and do not constitute, financial, investment, trading, or other types of advice or recommendations supplied or endorsed by TradingView. Read more in the Terms of Use.