Long
Dow Jones - Long
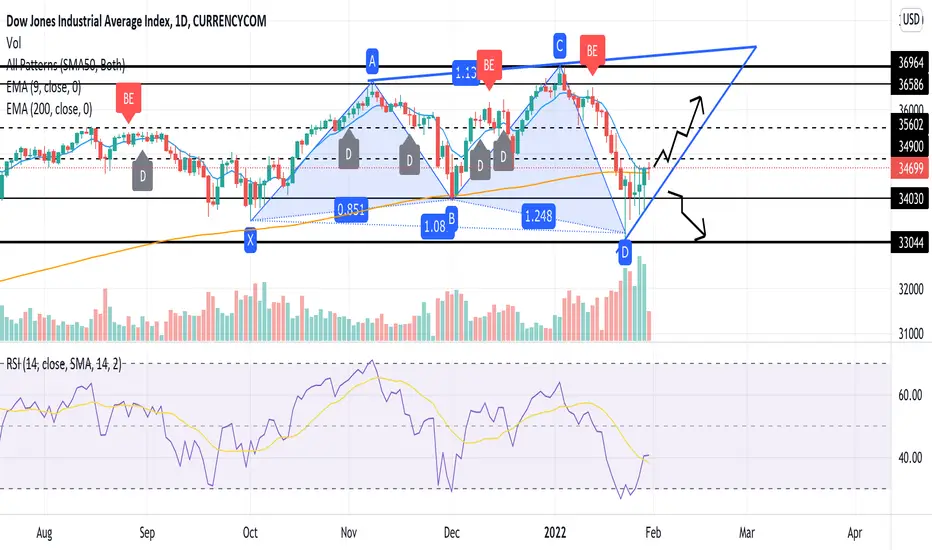
RSI - SMA is signaling buy on Dow. What do we want to see before we go long: Close higher than ema 9 (blue line) and ema 200 (orange line).
What do we don't want to see: daily close lower than this or sidewards trend breaking the triangle (blue line).
If you like this analysis - thumbs up!
________
🚀 Follow for daily posts
🎯 About my posts: They are kept self-explanatory in order to avoid overcomplicating and confusion. Mostly price signals and trend analysis combined with chart patterns.
Disclaimer: This is not an investment advice
Disclaimer
The information and publications are not meant to be, and do not constitute, financial, investment, trading, or other types of advice or recommendations supplied or endorsed by TradingView. Read more in the Terms of Use.
Disclaimer
The information and publications are not meant to be, and do not constitute, financial, investment, trading, or other types of advice or recommendations supplied or endorsed by TradingView. Read more in the Terms of Use.