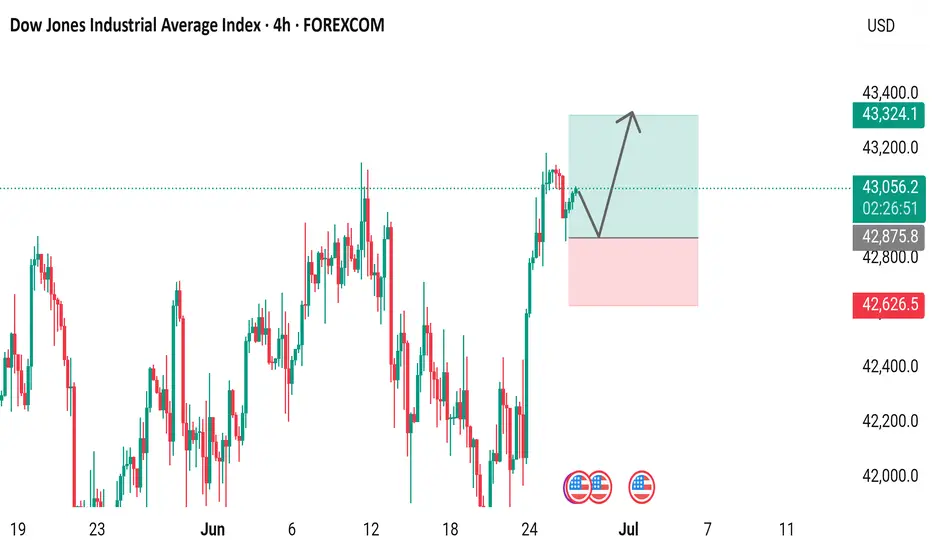
4-hour chart of the Dow Jones Industrial Average Index (US30) shows the price movement from late June to early July 2025. The current value is 43,057.7, reflecting a slight increase of +78.0 (+0.18%). The chart highlights key price levels, including a resistance zone around 43,324.1 and a support zone near 42,875.8, with recent price action showing a breakout above the resistance level.
Daily XAU/USD FREE setups | Let's grow together!
| XAU/USD Trader | Telegram: https://t.me/Aleegoldsignals
| XAU/USD Trader | Telegram: https://t.me/Aleegoldsignals
Disclaimer
The information and publications are not meant to be, and do not constitute, financial, investment, trading, or other types of advice or recommendations supplied or endorsed by TradingView. Read more in the Terms of Use.