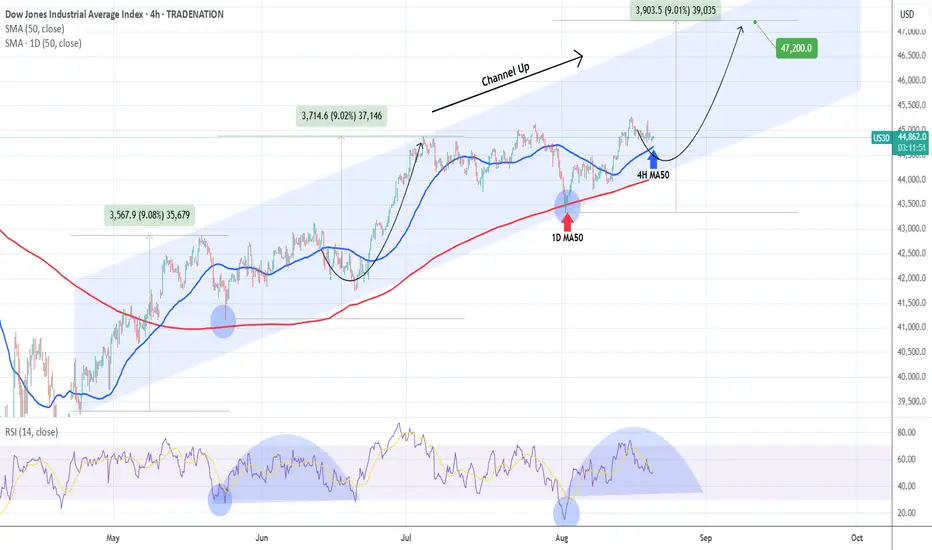
Dow Jones (DJI) has been trading within a 4-month Channel Up and following the recent High, the price started to pull-back ahead of this week's major macroeconomic events.
By doing so, it has approached the 4H MA50 (blue trend-line), which has been the first line of Support inside this pattern. The previous (Higher) Low of the Channel Up was priced on the 1D MA50 (red trend-line) and the 2 form the strongest medium-term Support Zone at the moment.
With even the 4H RSI fractals identical, the current price action resembles the June 12 one, post 1D MA50 Low (May 23). Even if the 4H MA50 breaks, the trend will remain bullish unless it closes a 1D candle below the 1D MA50 (which would also be an invalidation of the Channel Up).
The most common rise on a Bullish Leg on this pattern has been +9.00%. As a result, our Target is 47200 as we enter September.
-------------------------------------------------------------------------------
** Please LIKE 👍, FOLLOW ✅, SHARE 🙌 and COMMENT ✍ if you enjoy this idea! Also share your ideas and charts in the comments section below! This is best way to keep it relevant, support us, keep the content here free and allow the idea to reach as many people as possible. **
-------------------------------------------------------------------------------
Disclosure: I am part of Trade Nation's Influencer program and receive a monthly fee for using their TradingView charts in my analysis.
💸💸💸💸💸💸
👇 👇 👇 👇 👇 👇
👑Best Signals (Forex/Crypto+70% accuracy) & Account Management (+20% profit/month on 10k accounts)
💰Free Channel t.me/tradingshotglobal
🤵Contact info@tradingshot.com t.me/tradingshot
🔥New service: next X100 crypto GEMS!
💰Free Channel t.me/tradingshotglobal
🤵Contact info@tradingshot.com t.me/tradingshot
🔥New service: next X100 crypto GEMS!
Disclaimer
The information and publications are not meant to be, and do not constitute, financial, investment, trading, or other types of advice or recommendations supplied or endorsed by TradingView. Read more in the Terms of Use.