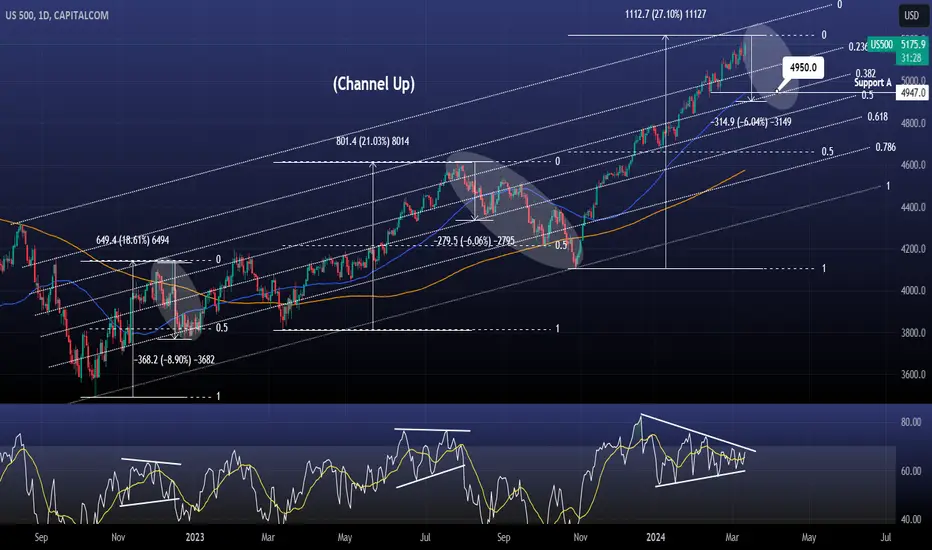
S&P500 / US500 is approaching the top of a Fibonacci Channel Up that goes back all the way to August 2022.
The 1day MA50 has been in firm support since November 3rd 2023 but as the 1day RSI is squeezed inside a Triangle pattern, a break out is inevitable.
This is technically more likely to be to the downside due to this overbought multi month momentum near the top of the Channel.
Sell and target 4950 (Support A, 0.382 Channel Fib and -6.00% from the top).
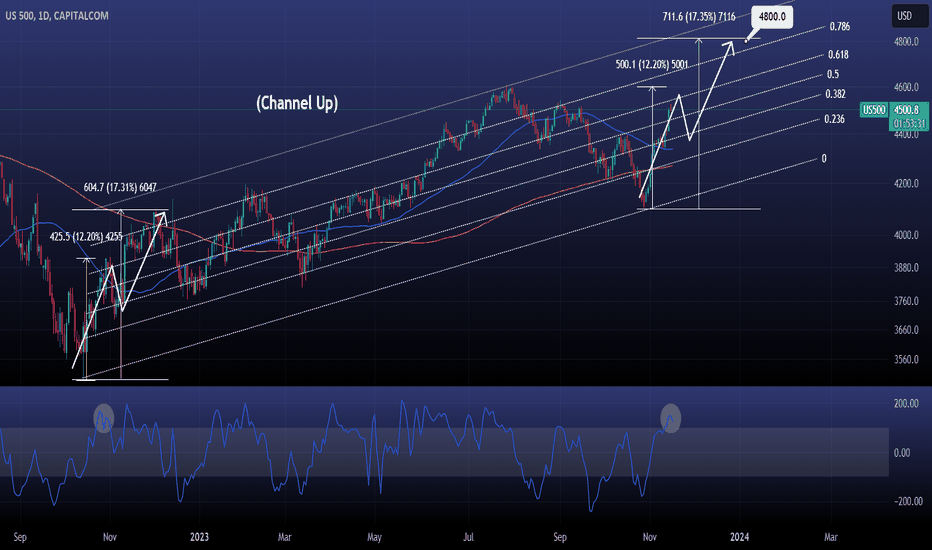
Previous chart:
Follow us, like the idea and leave a comment below!!
The 1day MA50 has been in firm support since November 3rd 2023 but as the 1day RSI is squeezed inside a Triangle pattern, a break out is inevitable.
This is technically more likely to be to the downside due to this overbought multi month momentum near the top of the Channel.
Sell and target 4950 (Support A, 0.382 Channel Fib and -6.00% from the top).
Previous chart:
Follow us, like the idea and leave a comment below!!
TheCryptagon offers news & insights on global markets (crypto, forex, stocks, commodities). Follow so you don't miss anything!
🤑Message us for private forex & crypto signals in our VIP channel (70% accuracy)!💰
TELEGRAM: t.me/thecryptagon
🤑Message us for private forex & crypto signals in our VIP channel (70% accuracy)!💰
TELEGRAM: t.me/thecryptagon
Disclaimer
The information and publications are not meant to be, and do not constitute, financial, investment, trading, or other types of advice or recommendations supplied or endorsed by TradingView. Read more in the Terms of Use.