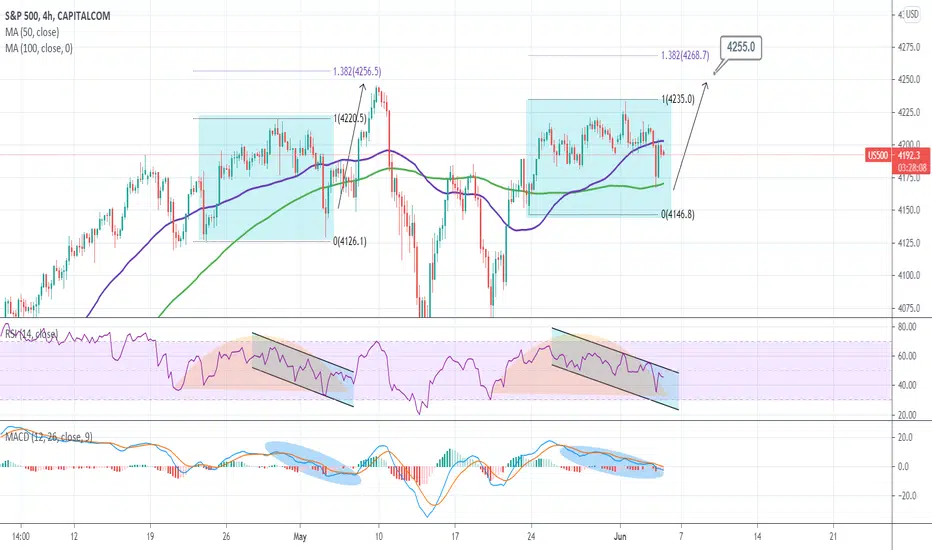
Both in terms of RSI/ MACD and the way the price trades on the 4H MA50 (blue trend-line) and the 4H MA100 (green trend-line), S&P500 appears to be replicating the late April - early May fractal. After a bottom on the Support, the price rebounded just below the 1.382 Fibonacci extension. That is currently just below 4270. I believe that following tomorrow's Nonfarm Payrolls, as similar price spike will occur.
Most recent S&P500 analysis:
** Please support this idea with your likes and comments, it is the best way to keep it relevant and support me. **
--------------------------------------------------------------------------------------------------------
!! Donations via TradingView coins also help me a great deal at posting more free trading content and signals here !!
🎉 👍 Shout-out to TradingShot's 💰 top TradingView Coin donor 💰 this week ==> CryptoSurfer007
--------------------------------------------------------------------------------------------------------
👑Best Signals (Forex/Crypto+70% accuracy) & Account Management (+20% profit/month on 10k accounts)
💰Free Channel t.me/tradingshotglobal
🤵Contact info@tradingshot.com t.me/tradingshot
🔥New service: next X100 crypto GEMS!
💰Free Channel t.me/tradingshotglobal
🤵Contact info@tradingshot.com t.me/tradingshot
🔥New service: next X100 crypto GEMS!
Disclaimer
The information and publications are not meant to be, and do not constitute, financial, investment, trading, or other types of advice or recommendations supplied or endorsed by TradingView. Read more in the Terms of Use.